
- THREE FLAGSHIP SYSTEMS
Choose by Test Method, Not by Model Number
Three clear paths from stable exposure to controlled cycling and abrupt transition.
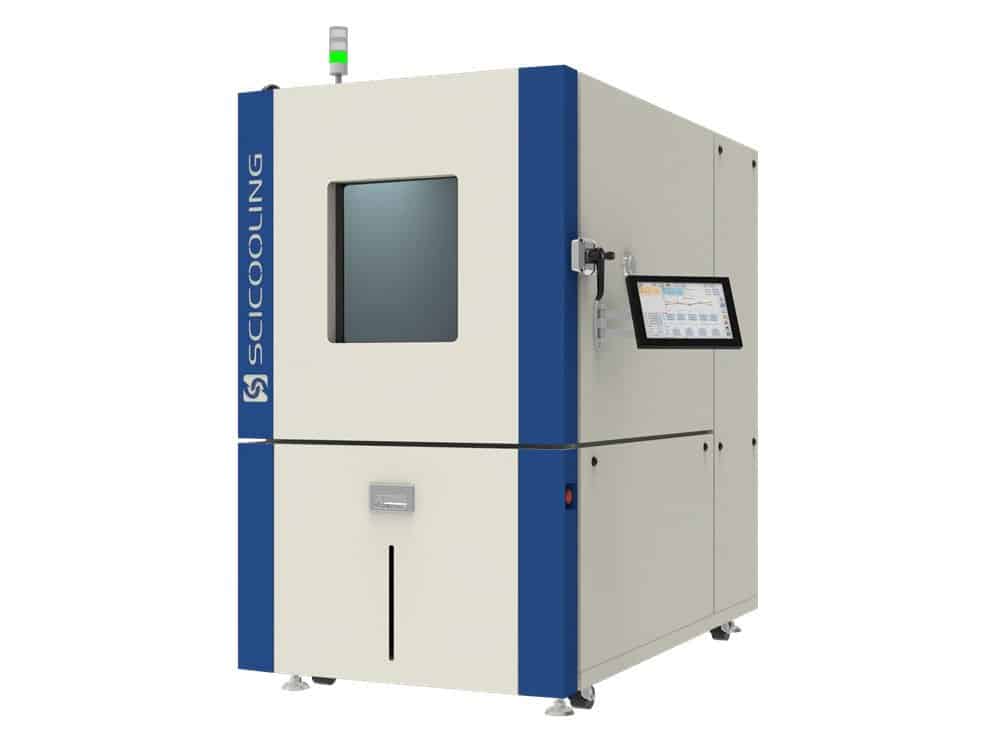
Constant Temperature & Humidity Chambers
Stable climate control for qualification, conditioning and long-duration exposure.
−60°C to +150°C
20%–95% RH
80–1,000 L
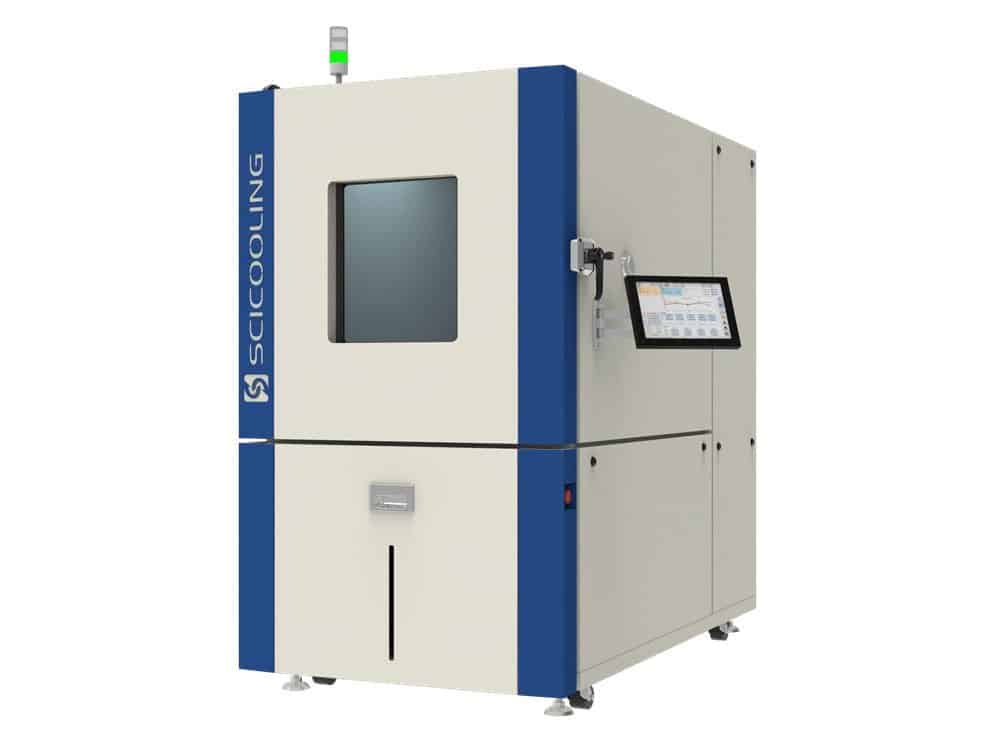
Rapid Temperature Change Chambers
Accelerate temperature cycling while the specimen stays in one controlled workspace.
−70°C to +150°C
5 / 10 / 15 / 20
150–1,000 L
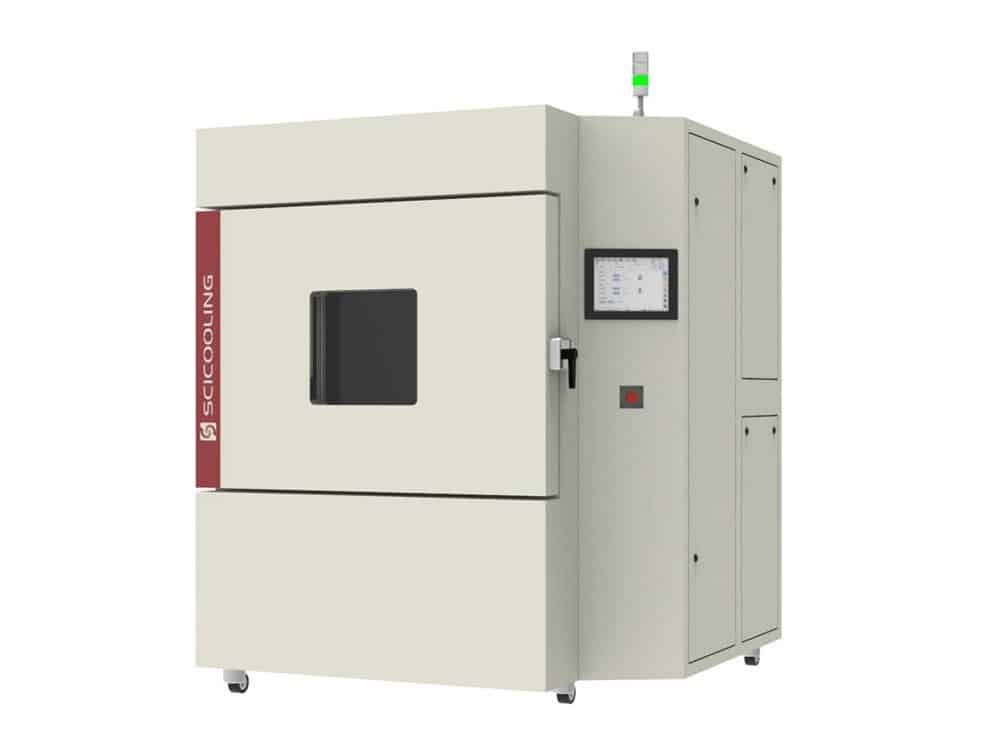
Thermal Shock Chambers
Reveal weaknesses through abrupt transfer between hot and cold conditioned zones.
Up to −100°C
≤ 15 s
≤ 5 min
- THREE FLAGSHIP SYSTEMS
Three Different Ways to Apply Environmental Stress
Click each method to see how the specimen experiences the test.
- THREE FLAGSHIP SYSTEMS
Choose by Test Method, Not by Model Number
Maintain defined temperature and humidity conditions for hours, days or longer. Best for qualification, conditioning, storage simulation and accelerated aging.
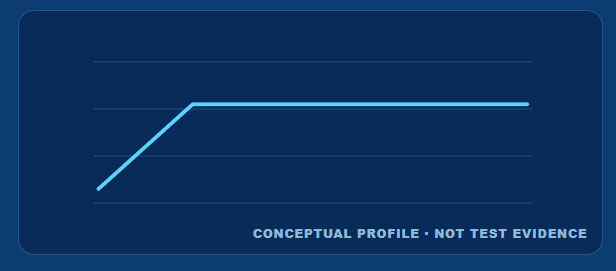
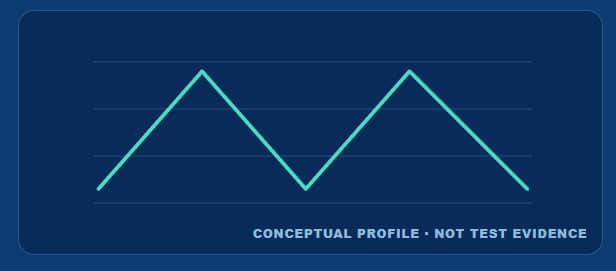
- RAPID TEMPERATURE CHANGE
Follow a Programmed Profile
Heat and cool the specimen through a controlled profile while it remains in one workspace. Best for cycling, ESS and accelerated reliability evaluation.
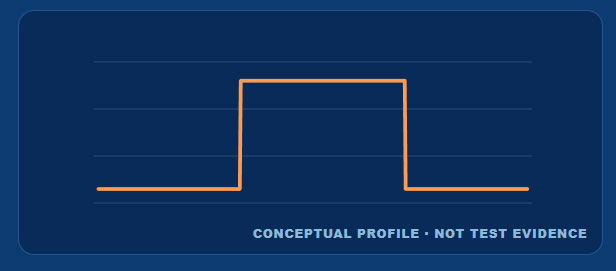
- THERMAL SHOCK
Switch Between Hot and Cold
Expose the specimen to a severe transition between conditioned zones to reveal cracking, fatigue, delamination and parameter drift.
| TEST NEED | METHOD REQUIREMENT | RECOMMENDED SYSTEM |
| Stable temperature / humidity exposure | Hold a defined environment | Constant Temperature & Humidity |
| Controlled temperature ramp or cycling | Programmed profile in one workspace | Rapid Temperature Change |
| Abrupt hot‑to‑cold transfer | Severe transition between zones | Thermal Shock |
| Not sure / mixed program | Standard and load still need review | Engineering consultation first |
- FLAGSHIP CLIMATE PLATFORM · PERFORMANCE PROOF
Wide Temperature & Humidity Coverage—Backed by Original Records
Source hierarchy is now explicit: original controller, recorder and equipment photographs are shown whenever available. A web chart is generated only when the source exists solely as Excel or CSV data.
- SELECTED-CONFIGURATION REFERENCE
- SELECT A VERIFIED RECORD
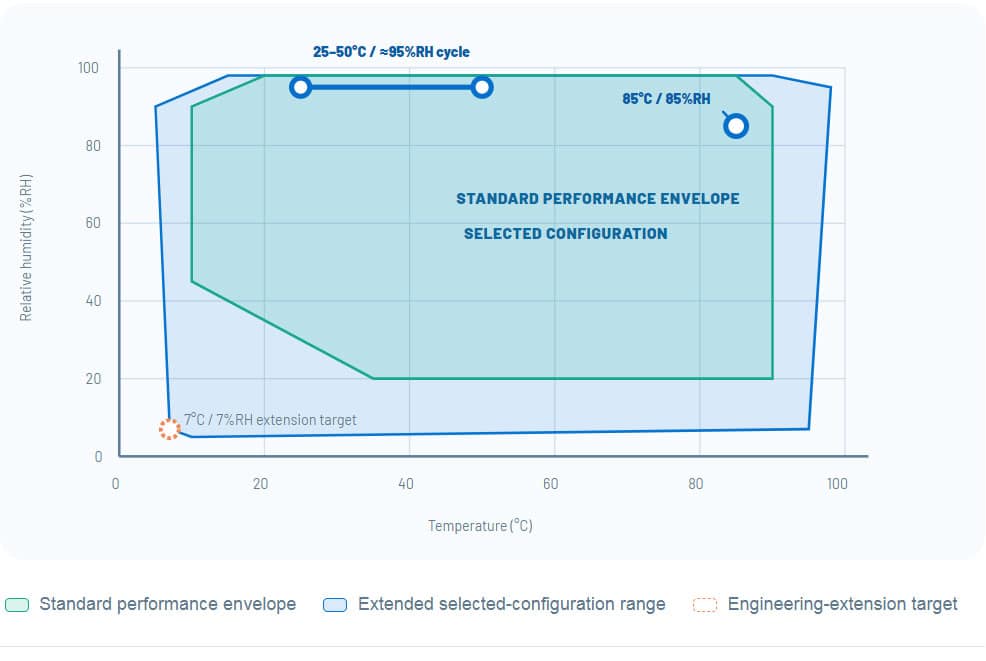
Temperature–Humidity Operating Envelope
- VERIFIED RECORD NAVIGATOR
- Point = steady condition · bar = cycle range · programs are not forced into one coordinate
CYCLIC RANGE
Original controller trend
STEADY POINT
Long-duration recorder export
MULTI-STEP PROGRAM
Original SP2593 spreadsheet
- GOLDEN PRODUCT PLATFORM
From 408 L Product Detail to Family-Level Verification
- The 408 L page gives buyers a concrete product structure. This proof layer adds the wider climate-platform evidence needed to judge performance—not only dimensions.
Jan–Mar
25–50°C
6 days
−10–65°C
- REAL SP / PV RECORDS
Five Original Records. Source Interfaces Preserved.
Select an original recorder export, controller screen or physical controller photograph. No curve in this five-record module is redrawn.
- 5 ORIGINAL RECORDS · 0 CURVES REDRAWN
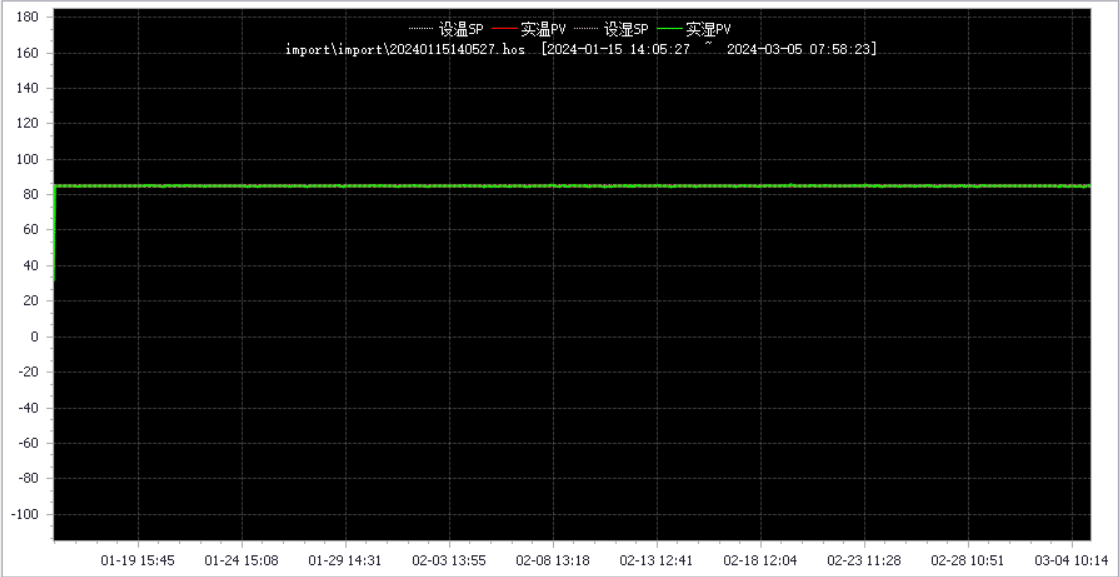
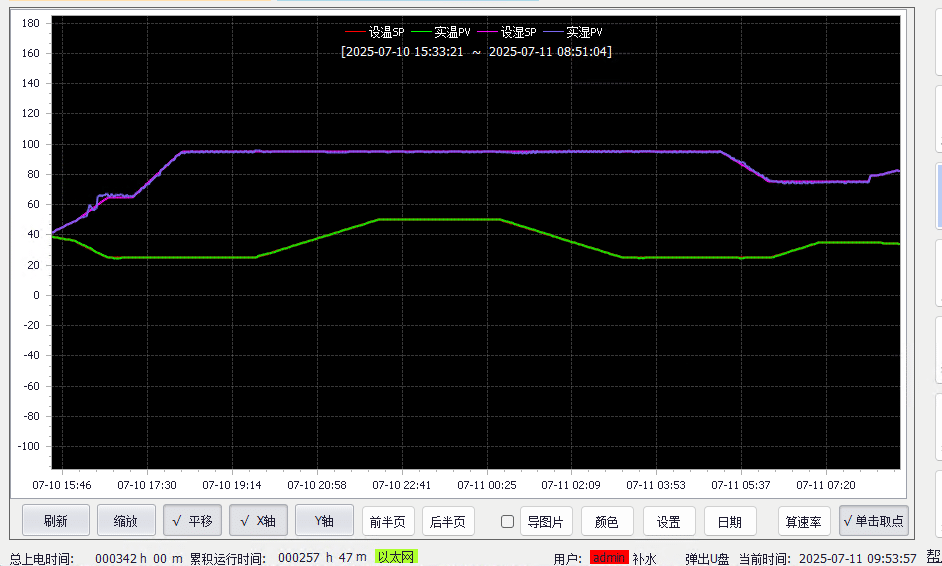
- ORIGINAL RECORDER EXPORT
85°C / 85%RH · Long-Duration Recorder Export
- ENGLISH READING GUIDE · ORIGINAL CHINESE RETAINED
PROJECT / RECORD
LOAD DISCLOSURE
CONDITION
PROJECT CHALLENGE
SCI response: The source recorder image is retained at full aspect ratio; no curve reconstruction or smoothing is applied.
- ORIGINAL CONTROLLER RECORD
25–50°C High-Humidity Cycle · Original Controller Record
- ENGLISH READING GUIDE · ORIGINAL CHINESE RETAINED
PROJECT / RECORD
LOAD DISCLOSURE
CONDITION
PROJECT CHALLENGE
SCI response: The native controller interface, timestamps and source traces are retained unchanged.
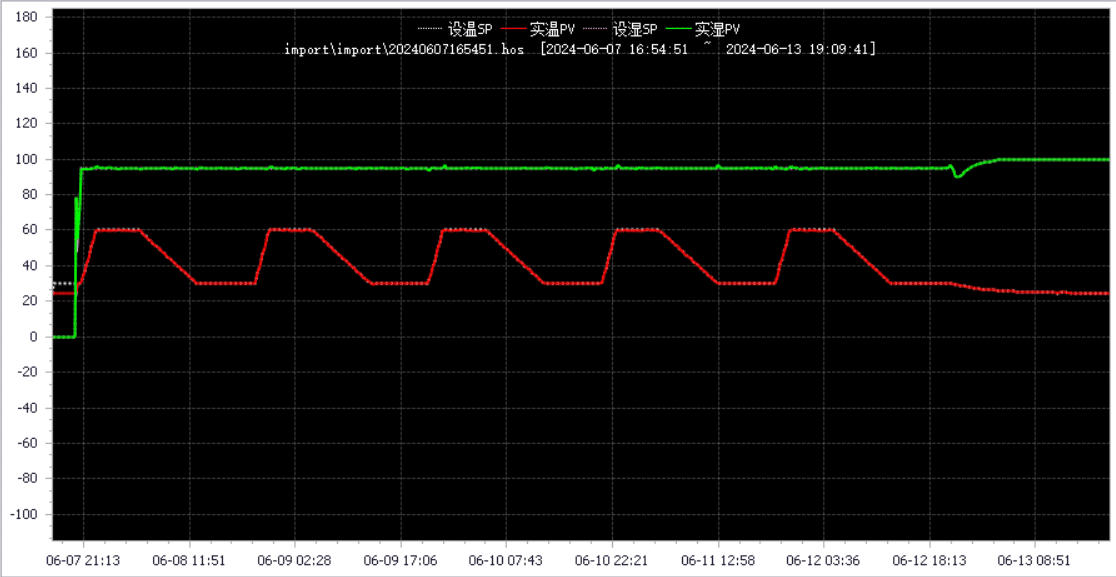
- ORIGINAL RECORDER EXPORT
SP1974 · Repeated 30–60°C High-Humidity Cycle
- ENGLISH READING GUIDE · ORIGINAL CHINESE RETAINED
PROJECT / RECORD
LOAD DISCLOSURE
CONDITION
PROJECT CHALLENGE
SCI response: The recorder identity, complete time axis and original traces are shown together.
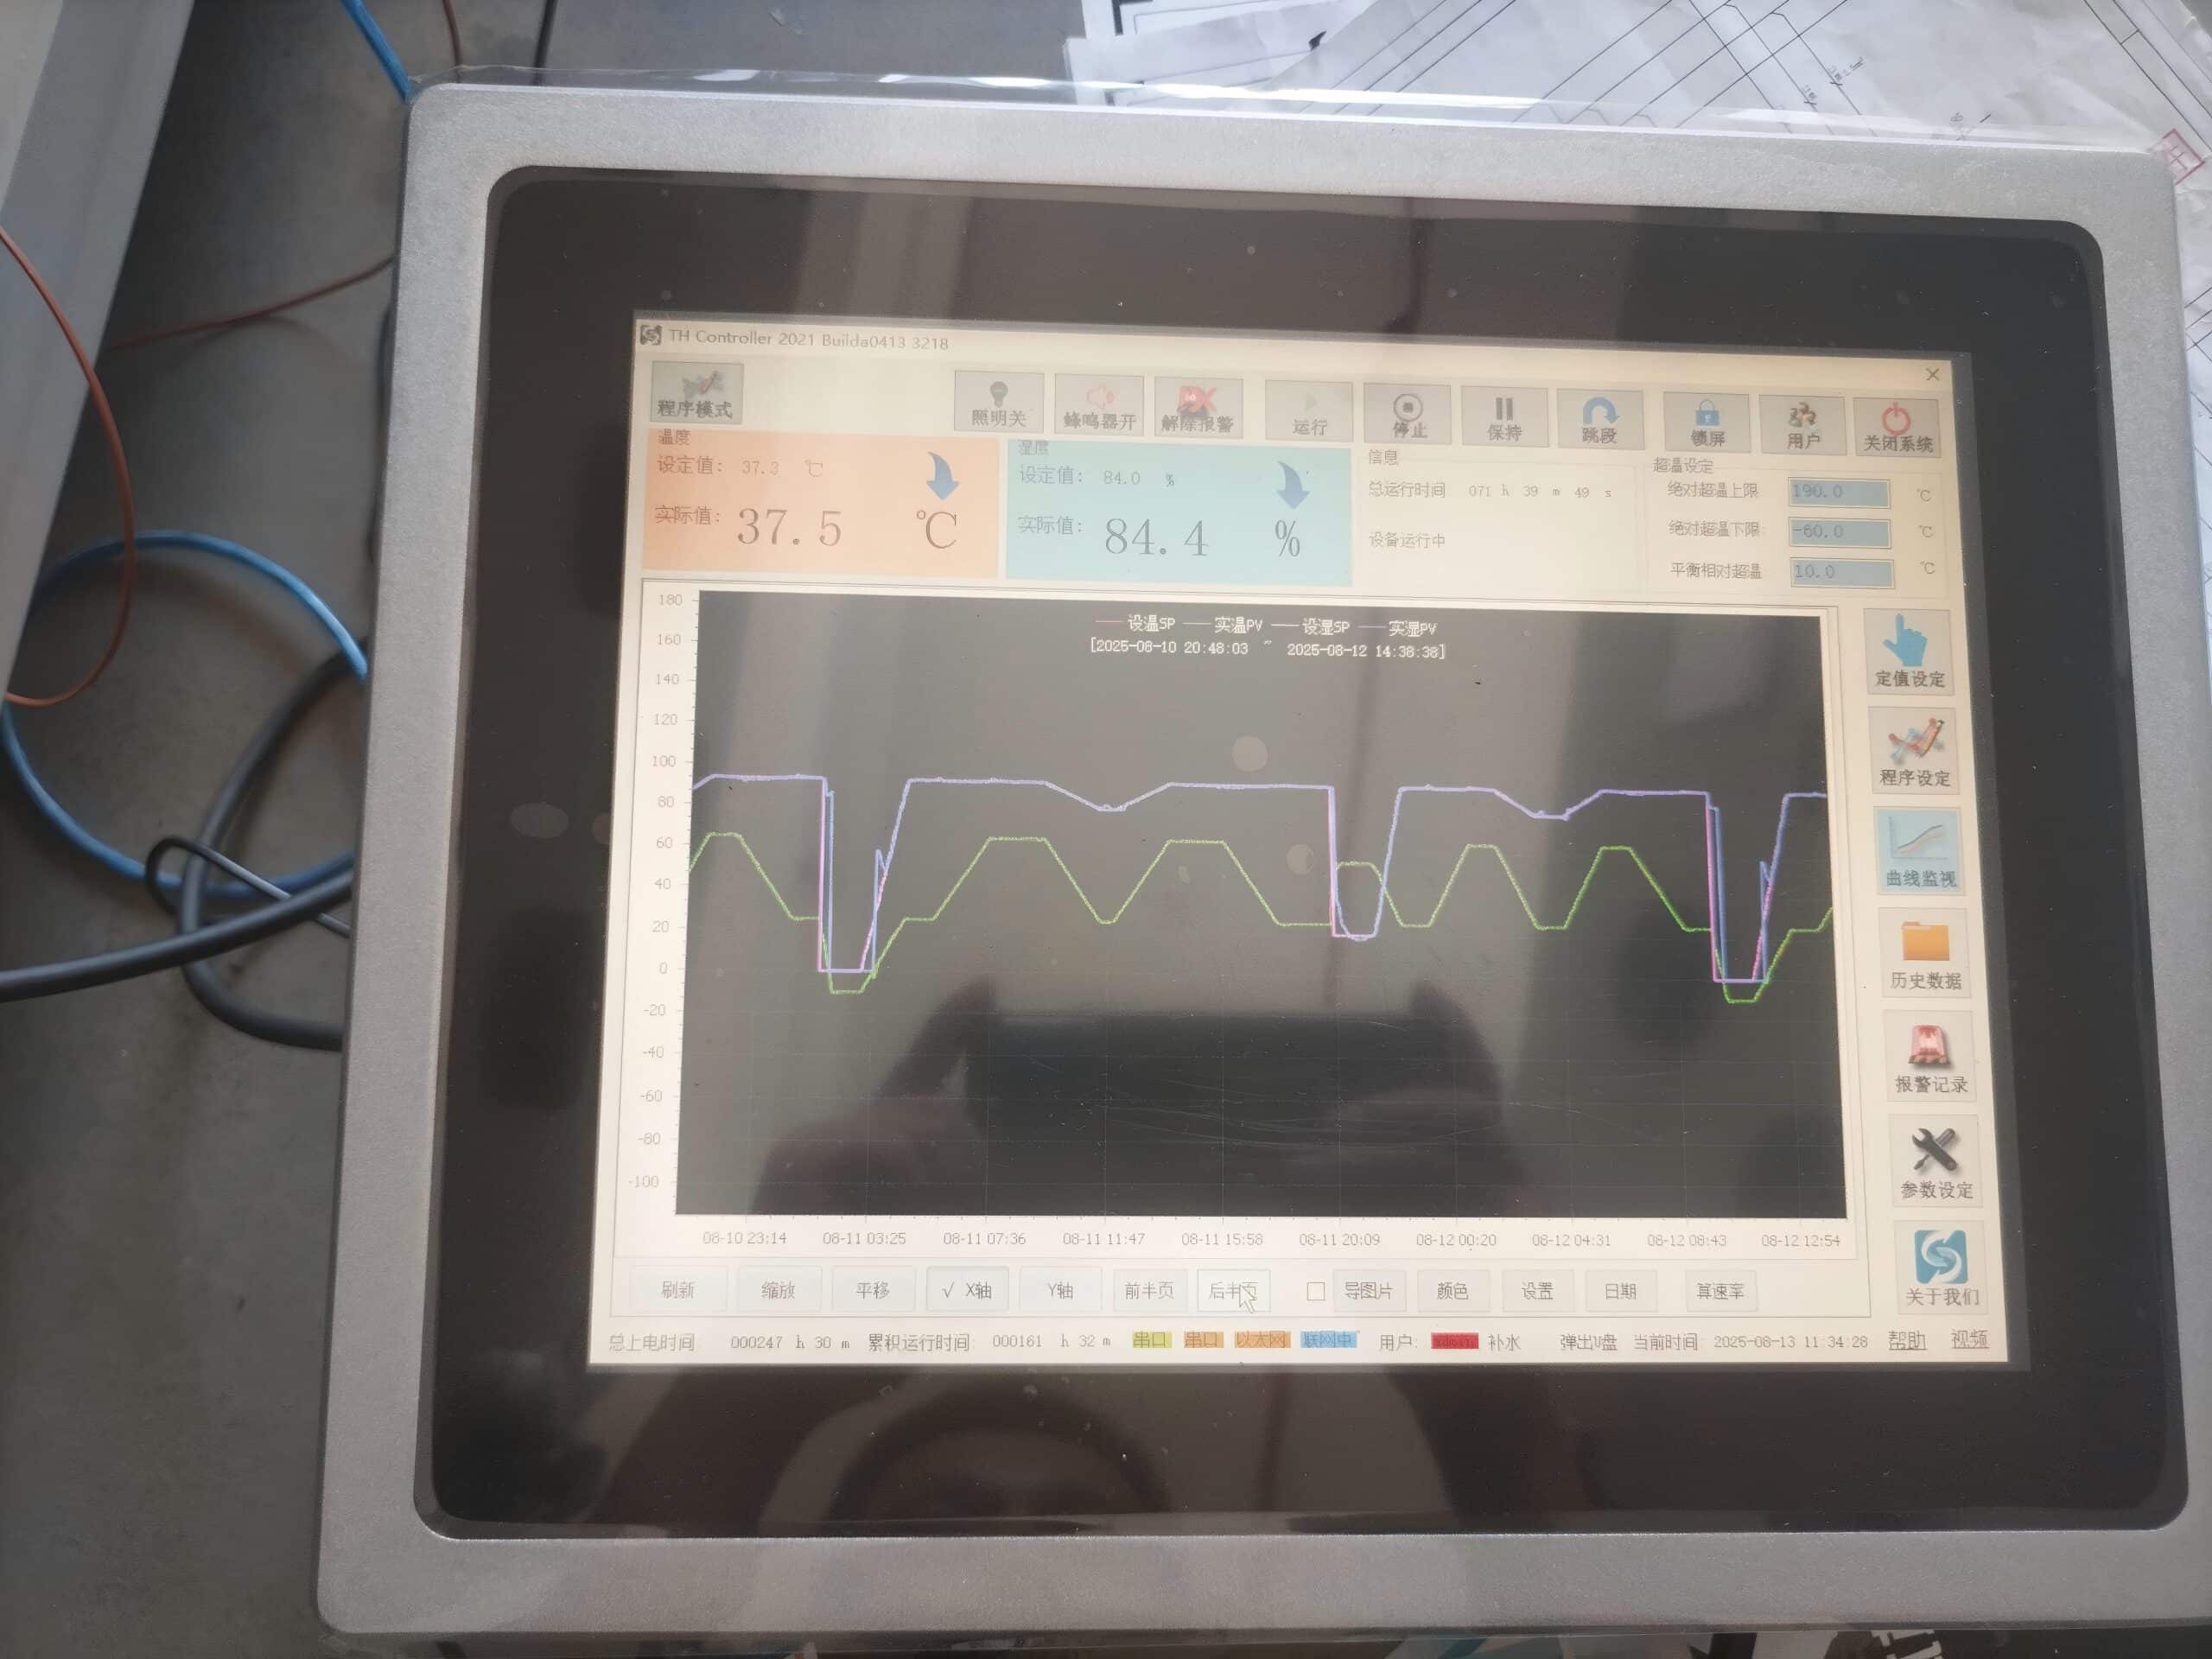
- PHYSICAL CONTROLLER PHOTOGRAPH
Physical Controller Record · Multi-Cycle Temperature-Humidity Program
- ENGLISH READING GUIDE · ORIGINAL CHINESE RETAINED
PROJECT / RECORD
LOAD DISCLOSURE
CONDITION
PROJECT CHALLENGE
SCI response: The physical controller photograph is shown as supplied; no standard designation is inferred from the image alone.
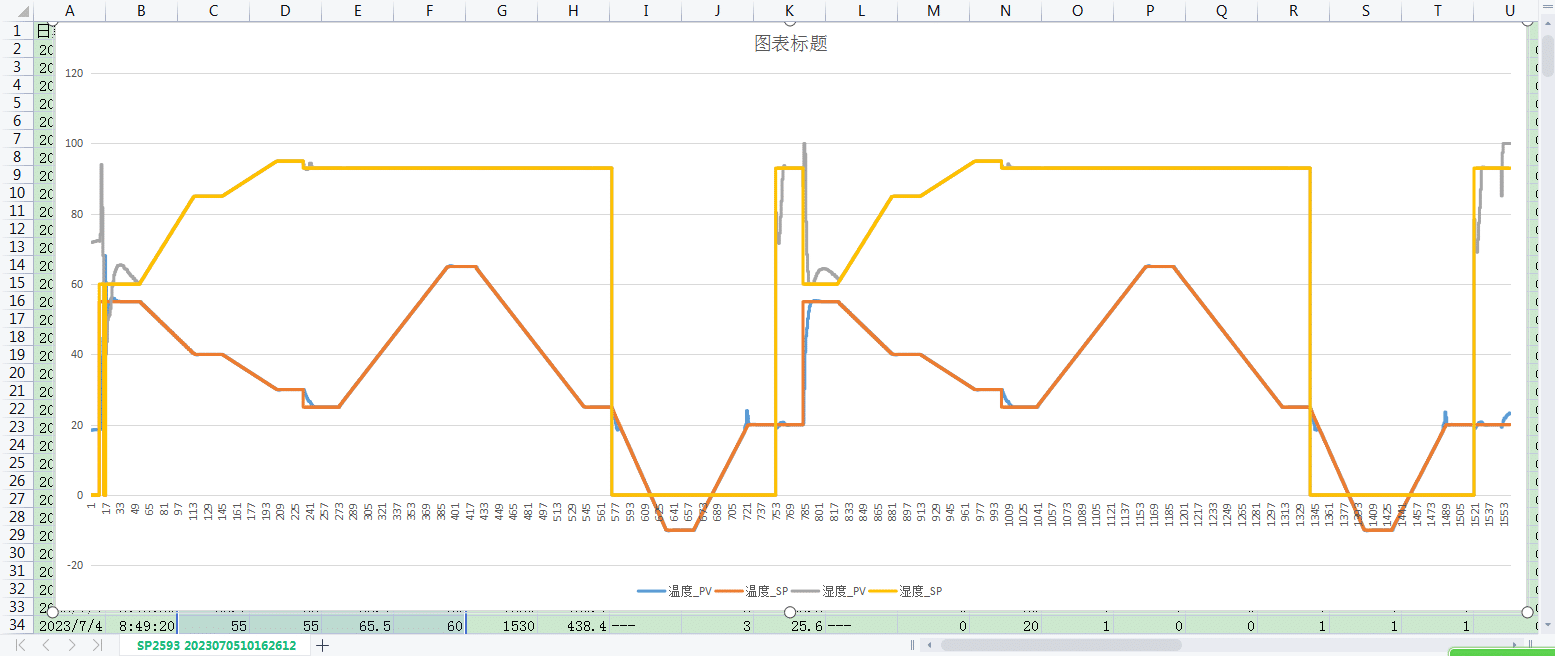
- ORIGINAL SPREADSHEET SCREENSHOT
SP2593 · Repeated Multi-Step Temperature-Humidity Program
- ENGLISH READING GUIDE · ORIGINAL CHINESE RETAINED
PROJECT / RECORD
LOAD DISCLOSURE
CONDITION
PROJECT CHALLENGE
SCI response: The supplied spreadsheet screenshot is retained; the English guide explains the original Chinese legend without redrawing the chart.
- ACTUAL VERIFICATION PHOTO
- Controller program and live operating values
- FROM PROGRAM TO MEASURED CURVE
The controller executes the profile. The recorder proves the result.
This genuine controller photograph shows a programmed temperature sequence and live operating values during SCI verification. It adds test-process context without repeating the workshop and functional-testing photos shown below. Exact project-unit photos can replace it when the record and publication approval are available.
How to use this evidence: records are presented as project and factory-verification proof, not as a universal guarantee for every model. Customer identity, specimen load, selected options, ambient condition and acceptance standard must be confirmed before external case publication or order acceptance.
- 37 DOCUMENTED CASES · FOUR PRODUCT CATEGORIES
Performance You Can Inspect, Not Just a Maximum on a Datasheet
The four representative categories now use supplied original recorder or controller images. Excel/CSV-derived web charts remain reserved for cases that have no original visual record.
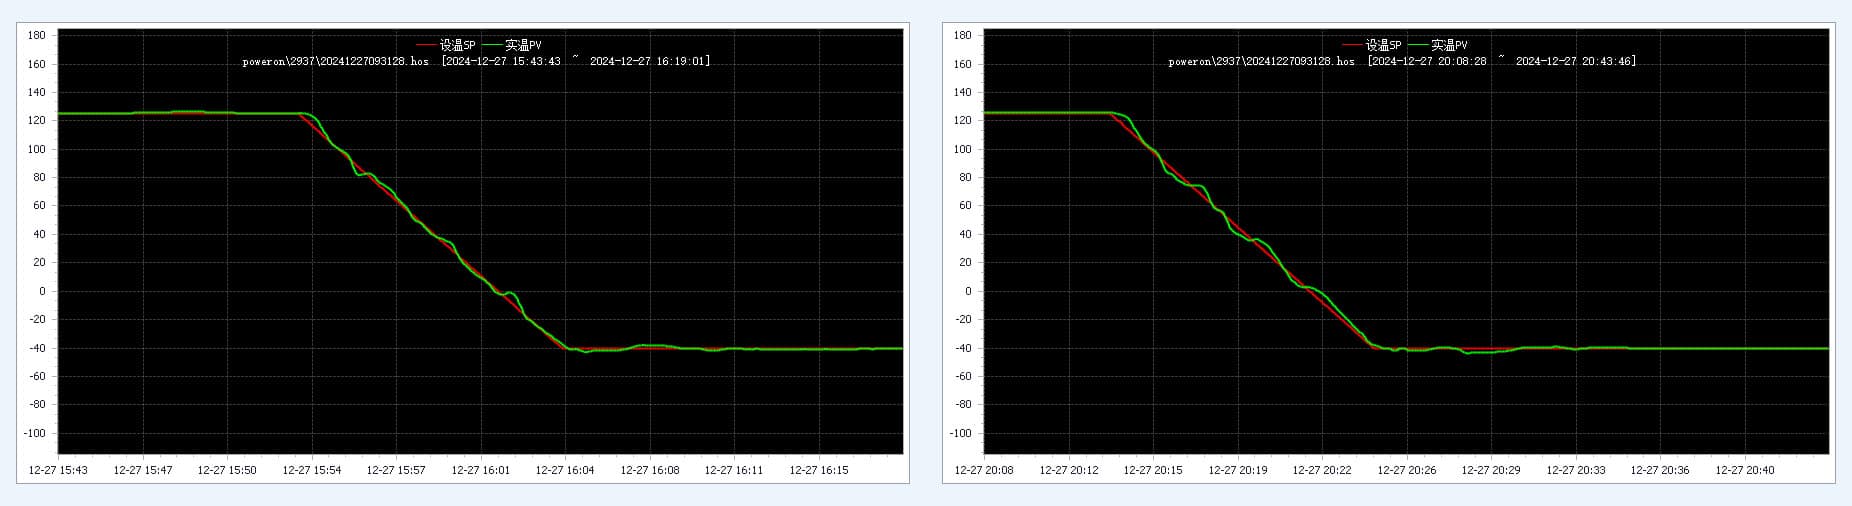
- CASE R4 · SP2937 · 2024
2 m³ loaded rapid-change verification
Two original recorder exports show the same SP2937 project cooling from approximately 125°C to −40°C
14.95°C/min
22.68°C/min
2 source screens
27 Dec 2024
What it proves: the original SP/PV traces are shown directly; calculated rates remain tied to the supplied Excel ranges.
- ORIGINAL RECORDER EXPORT · R4 / SP2937 · NO CURVE REDRAW
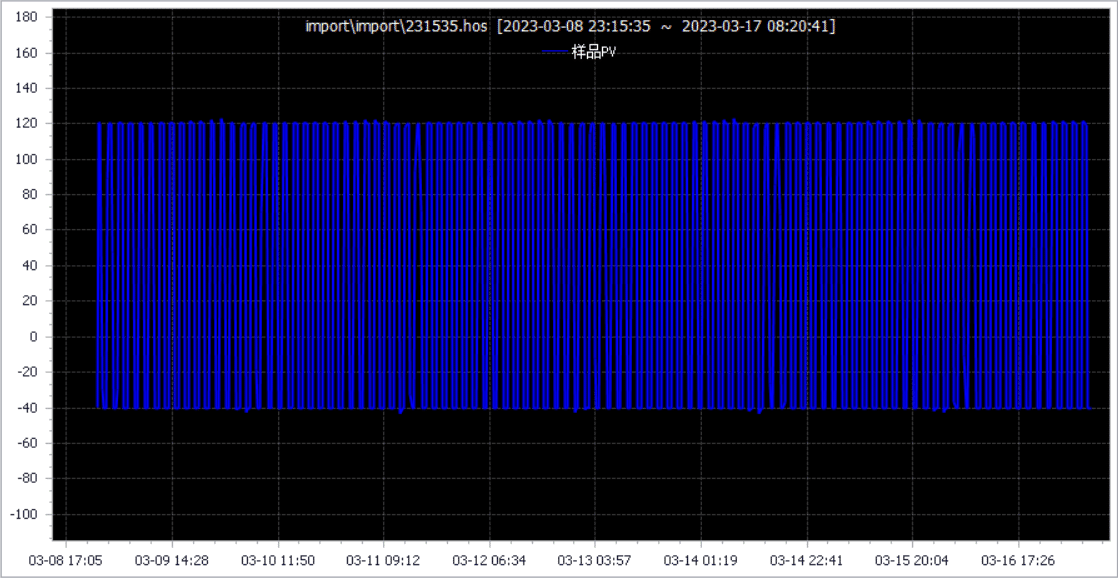
- CASE S4 · SP2595 · 2023
100-cycle stored-cold thermal-shock endurance
The original long-window recorder export shows a three-chamber 120°C / −40°C sequence across 100 cycles.
100 cycles
120 / −40°C
8–17 Mar 2023
SP2595
What it proves: cycle continuity and repetition are visible in the original recorder export; recovery-time acceptance remains tied to the detailed source package.
- ORIGINAL RECORDER EXPORT · S4 / SP2595 · NO CURVE REDRAW
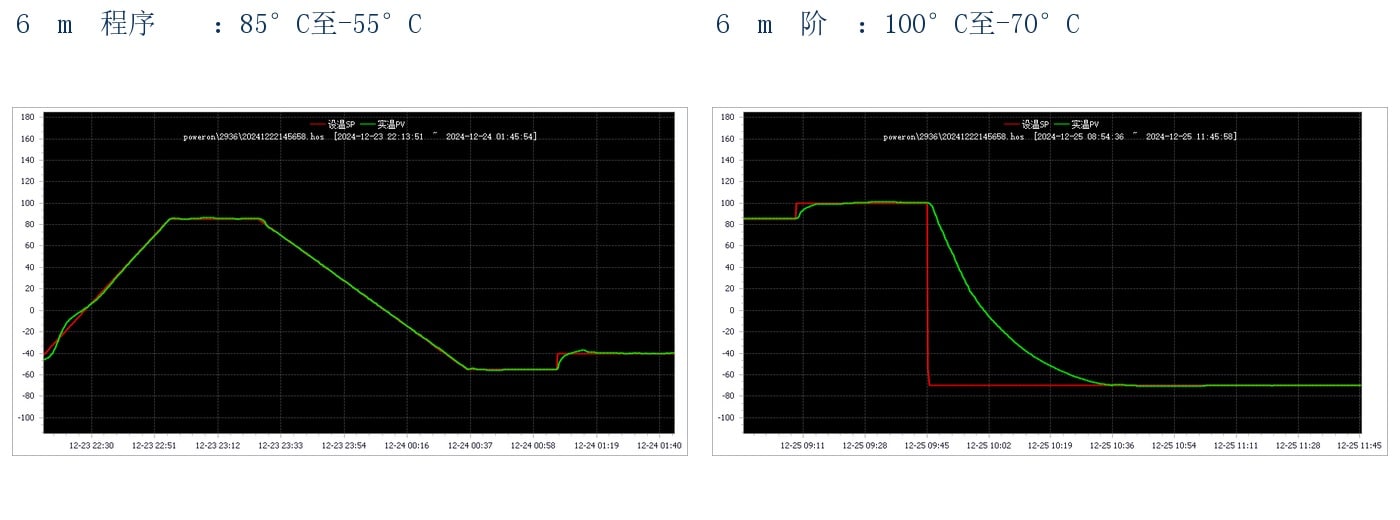
- CASE H8 · SP2936 · 2024
6 m³ loaded chamber temperature coverage
Two original recorder exports show a loaded 6 m³ chamber program and a separate 100°C to −70°C stage.
6 m³
85 → −55°C
100 → −70°C
Loaded
What it proves: large-volume loaded temperature coverage is visible in the source screens. Humidity performance requires a separate humidity record.
- ORIGINAL RECORDER EXPORT · H8 / SP2936 · NO CURVE REDRAW
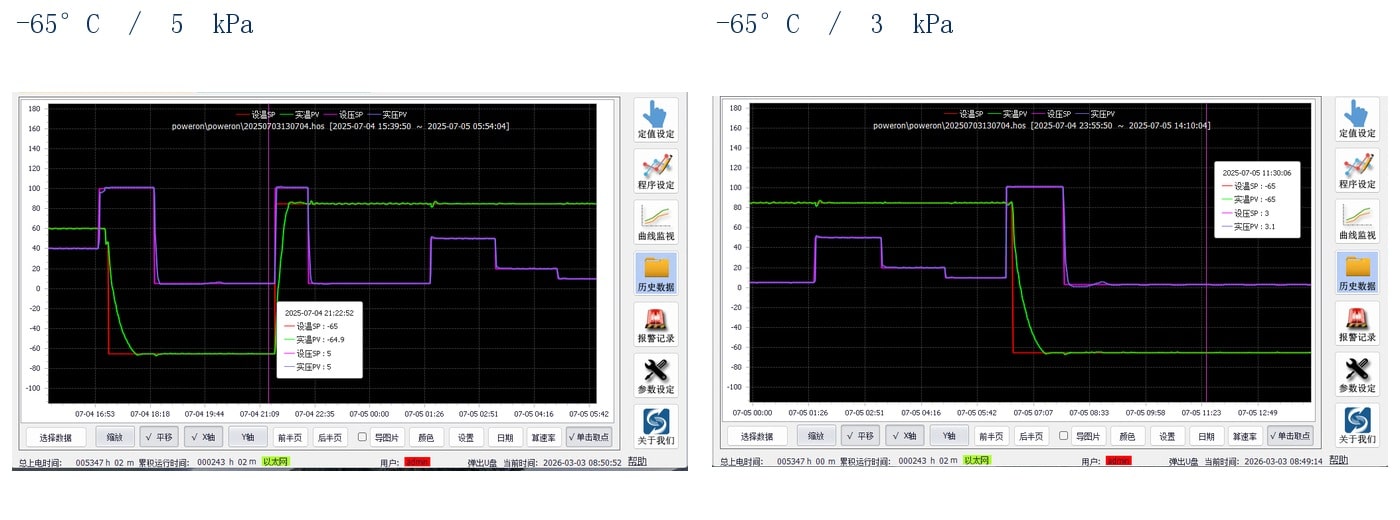
- CASE P4 · SP3022 · 2025
−65°C / 3–5 kPa extreme combination points
Two original controller screens retain the cursor readings for deep-low-temperature and low-pressure operation.
−64.9°C / 5 kPa
−65°C / 3.1 kPa
2 source screens
Pending
What it proves: the combined points were reached in the source screens. Accuracy and stability duration still require the raw data and acceptance rule.
- ORIGINAL CONTROLLER SCREENS · P4 / SP3022 · NO CURVE REDRAW
- Case library: 7 rapid-change, 14 thermal-shock, 10 temperature/humidity and 6 low-pressure records. Results are case-specific, not universal guarantees.
- MEASURED EFFICIENCY · COMMERCIAL VALUE
33% Measured. 30% Used for ROI.
The supplied comparison evidence records an actual 33% reduction. Every commercial forecast below deliberately uses a more conservative 30% planning factor, multiplied by the customer’s chamber quantity, baseline energy use and real operating schedule.
33%
Measured result, conservative commercial model
- The supplied same-condition comparison supports an actual 33% result. The customer-facing calculator does not extrapolate the full measured value: it uses 30% throughout.
SAME-CONDITION ENERGY COMPARISON
- BENCHMARK BRAND ANONYMIZED
Measured proof and planning basis
- The 408 L page gives buyers a concrete product structure. This proof layer adds the wider climate-platform evidence needed to judge performance—not only dimensions.
30% used in every forecast
- Source basis: supplied energy-comparison material and test summary. The benchmark manufacturer is intentionally not named. Results remain model-, load-, profile-, ambient- and method-specific; calculator output is a planning estimate, not a savings guarantee.
ORIGINAL SAME-CONDITION RECORD
- ORIGINAL IMAGE · NOT REDRAWN
Measured comparison shown in the supplied source image
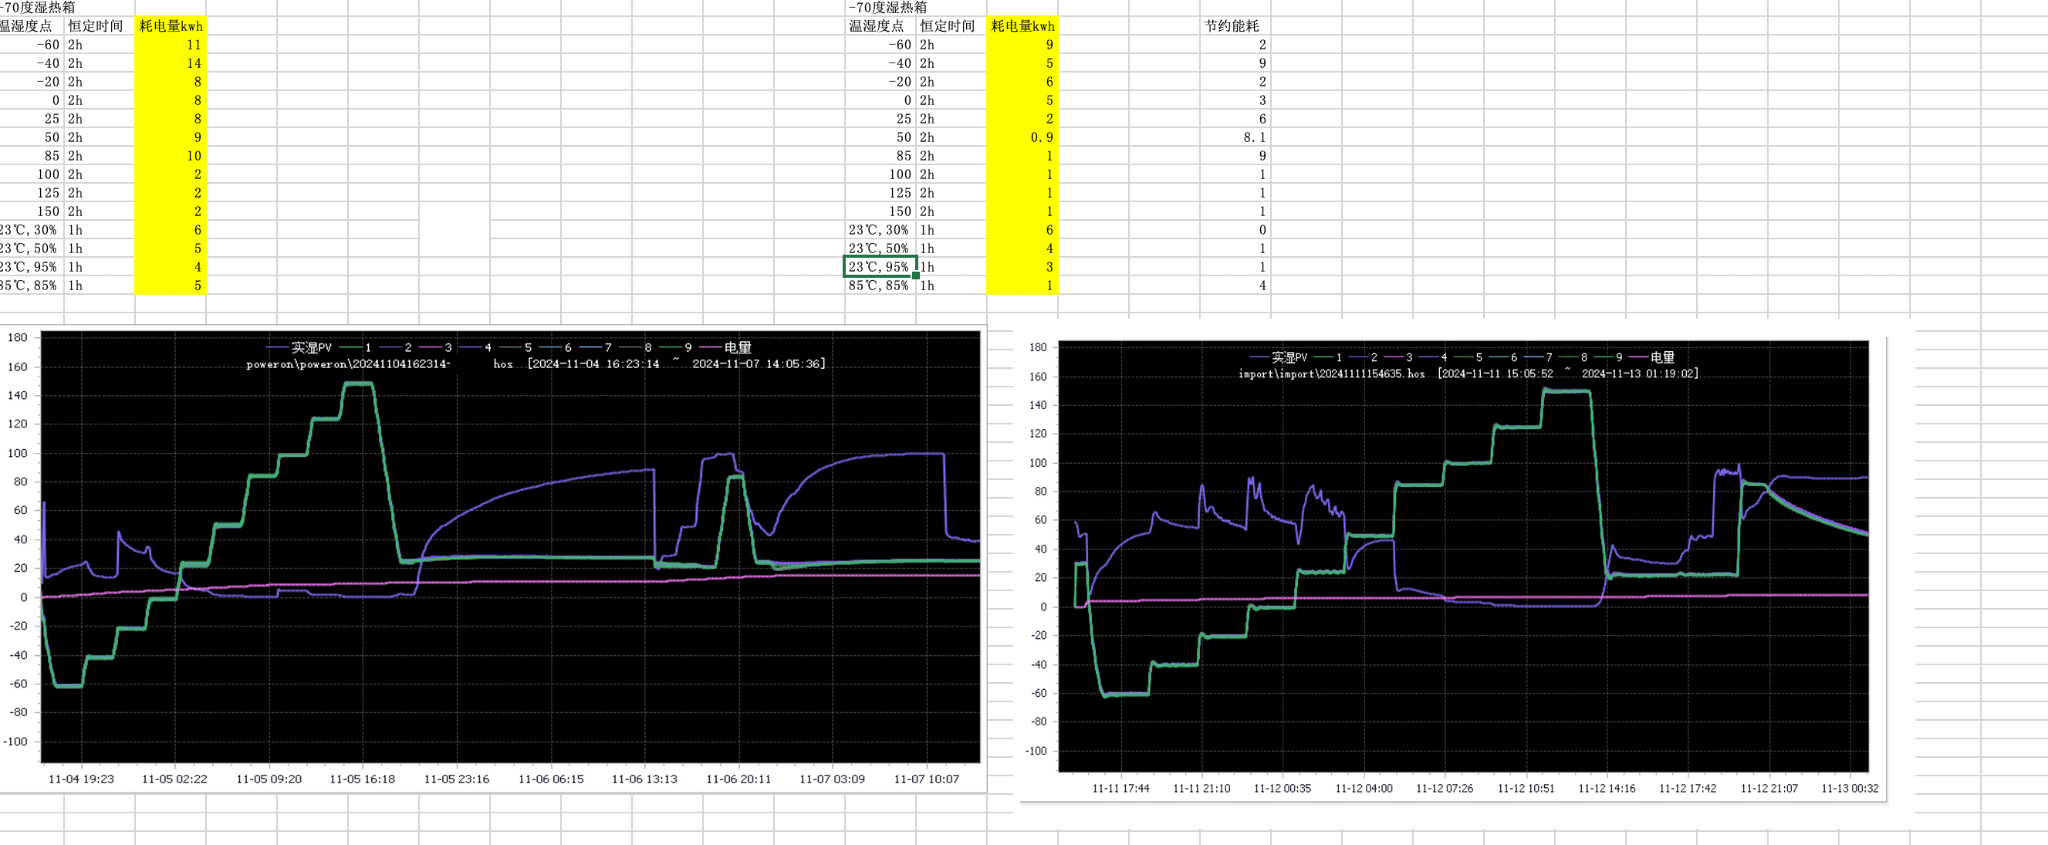
−70°C temperature-humidity chamber
Temperature-humidity point / hold time
Energy consumed (kWh) / energy saved
Measured temperature (PV)
Electrical energy trace
Recorded energy totals at each test point
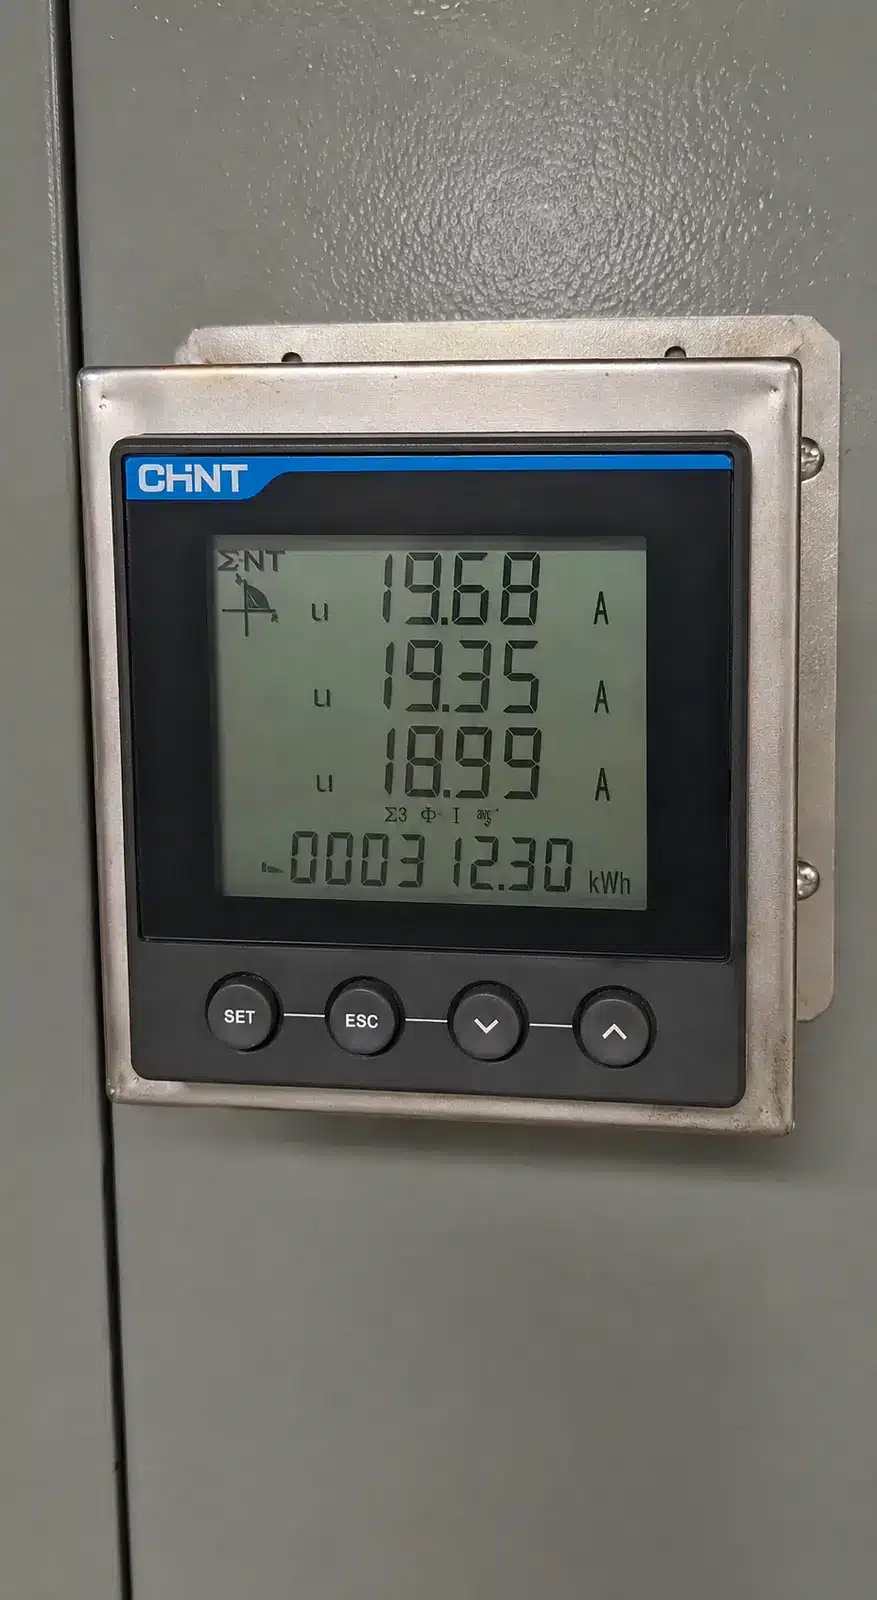
FIELD-MEASUREMENT EVIDENCE
Install a meter. Measure it on site.
The supplied meter photograph shows phase currents of approximately 19.68 A, 19.35 A and 18.99 A, with a displayed cumulative reading of approximately 312.30 kWh. SCI welcomes customer-installed metering under an agreed test condition.
- 01 · CONTROL LOGIC
Adaptive PID thermal control
- Matches cooling and heating output to the actual thermal demand instead of creating avoidable hot–cold compensation.
- 02 · REFRIGERATION
Variable-output compressor system
- Adjusts compressor speed and delivered capacity as the chamber moves from pull-down to stable operation.
- 03 · FLOW CONTROL
Electronic expansion regulation
- Fine refrigerant metering helps reduce cycling losses and improves efficiency across changing operating points.
WHY CONTROL ARCHITECTURE MATTERS
- ILLUSTRATIVE MECHANISM
Heat load and chamber current are connected.
- At partial load, fixed hot–cold balance control can keep cooling high and add heater power to compensate. Adaptive digital control follows the actual thermal demand, reducing avoidable simultaneous heating and cooling.
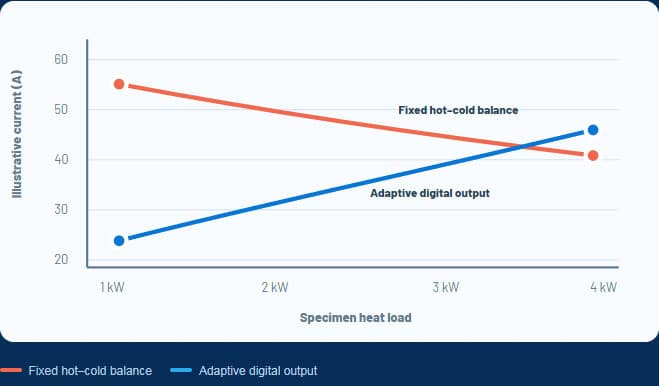
AUDITABLE ENERGY EVIDENCE
Four items turn a claim into proof.
- For a customer case or FAT package, use the same condition, same duration and a recorded load sheet—then retain the source evidence.
SCI raw power curve
Time-based kW trace from start, transition and hold.
Anonymous benchmark curve
Same chamber class, profile, duration and declared utilities.
Meter start / end images
Readable timestamp, meter identity and cumulative kWh.
Condition and specimen sheet
Model, ambient, humidity, load, heat output and method.
- Current page basis: the supplied comparison material supports the 33% measured result; every ROI forecast uses 30%. Final case-study publication should retain the original trace and meter images with the project record.
What Could 30% Lower Energy Use Be Worth Across Your Lab?
Enter the number of chambers and the baseline average energy use per chamber, then set actual operating days and peak / standard / off-peak hours.
Planning references: TNB Malaysia tariff structure and ToU periods · Thailand PEA tariffs and Ft · Vietnam EVN manufacturing tariff · Singapore EMA regulated tariff. Rate fields remain editable. Estimates exclude demand, network, taxes, fuel adjustments and other bill components unless already reflected in the entered rate; they are not a savings guarantee. Regional references: Eurostat EU non-household electricity prices · U.S. EIA industrial average · Dubai DEWA industrial tariff and fuel surcharge · Brazil ANEEL distributor tariff database. The Brazil value is an editable planning placeholder, not a national industrial tariff.
- BUILT FOR LONG SERVICE · VERIFIED BEFORE RELEASE
Quality Evidence That Continues After the Specification Sheet
Documented inspection depth and named long-running machines make the ownership story concrete.
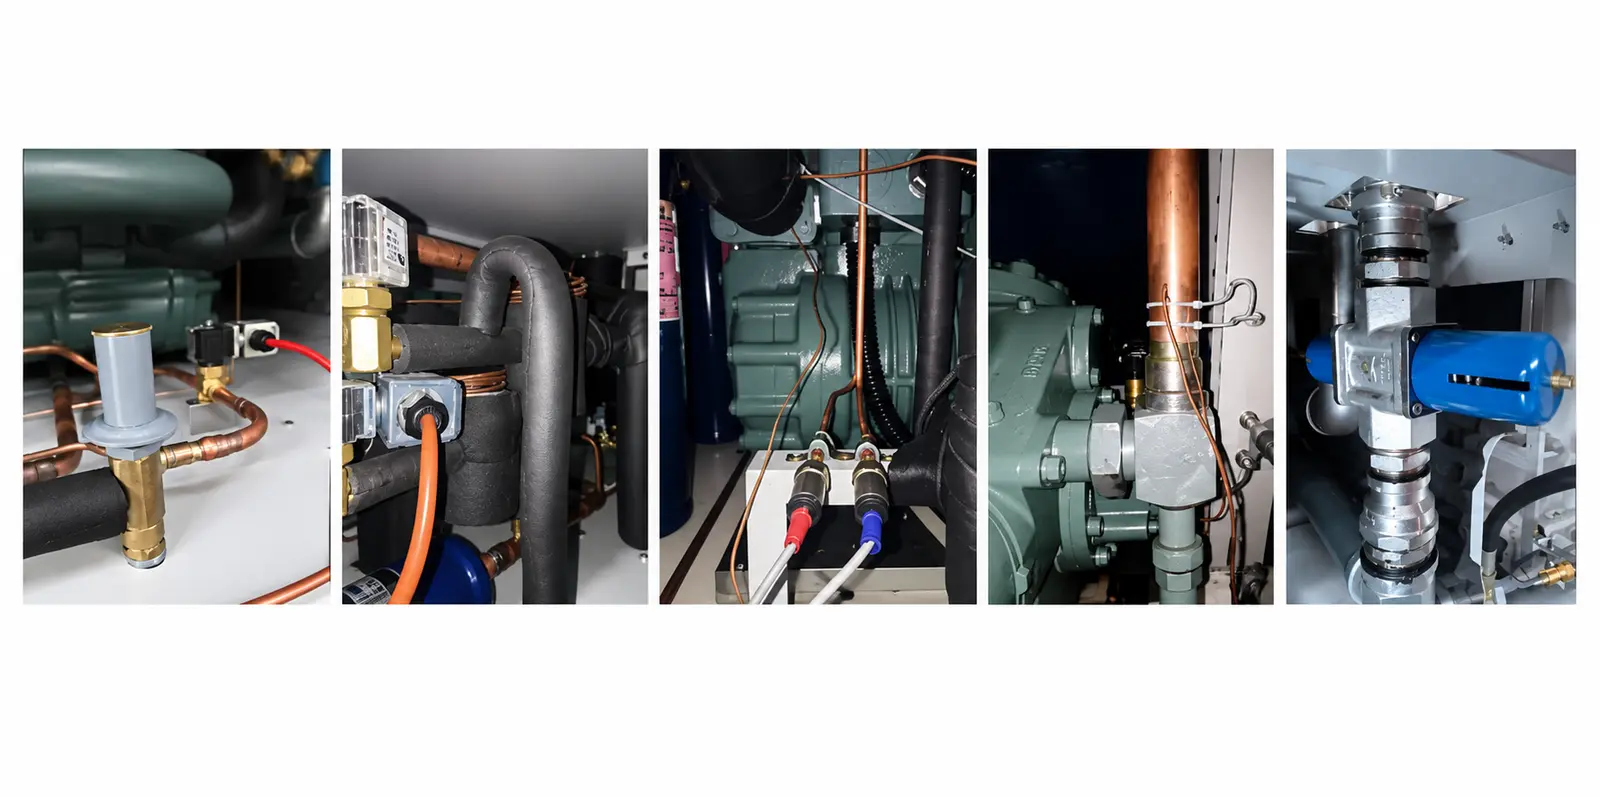
- FACTORY QUALITY SYSTEM
220 documented control points
Electrical, structure and appearance, refrigeration, and final commissioning are reviewed through a controlled release checklist.
4
3
Operator self-check
Next-process verification
Final QA release
- LONG-RUNNING FIELD EVIDENCE
Real machines, still doing the work
Three supplied records show different chamber types continuing in service across long operating histories, relocations and routine maintenance.
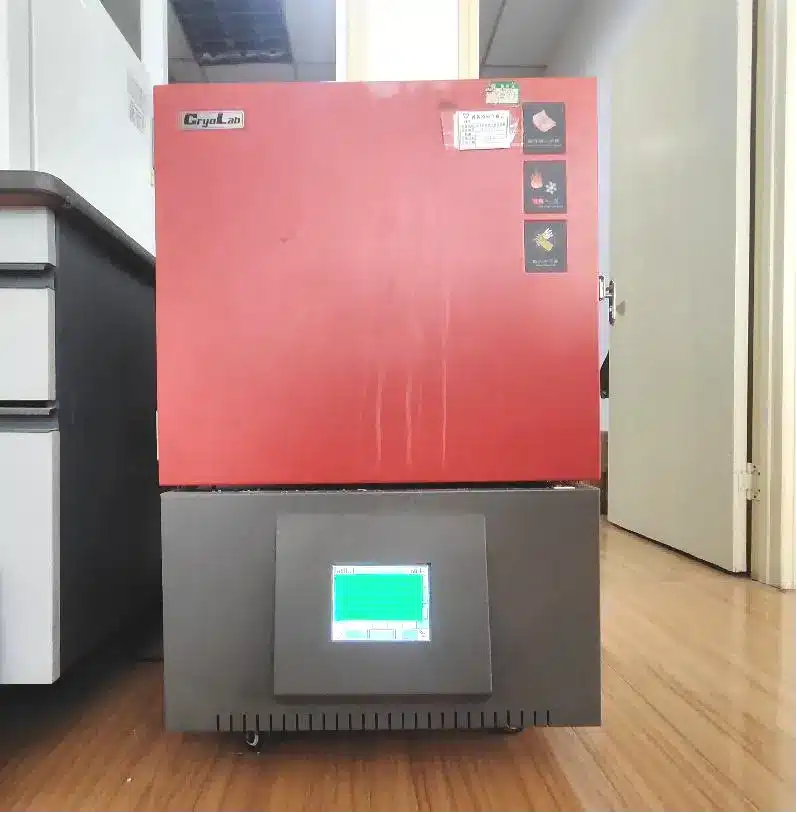
18+ years
30 L high/low temperature
Supplied in 2008; the cited unit remains in operation.
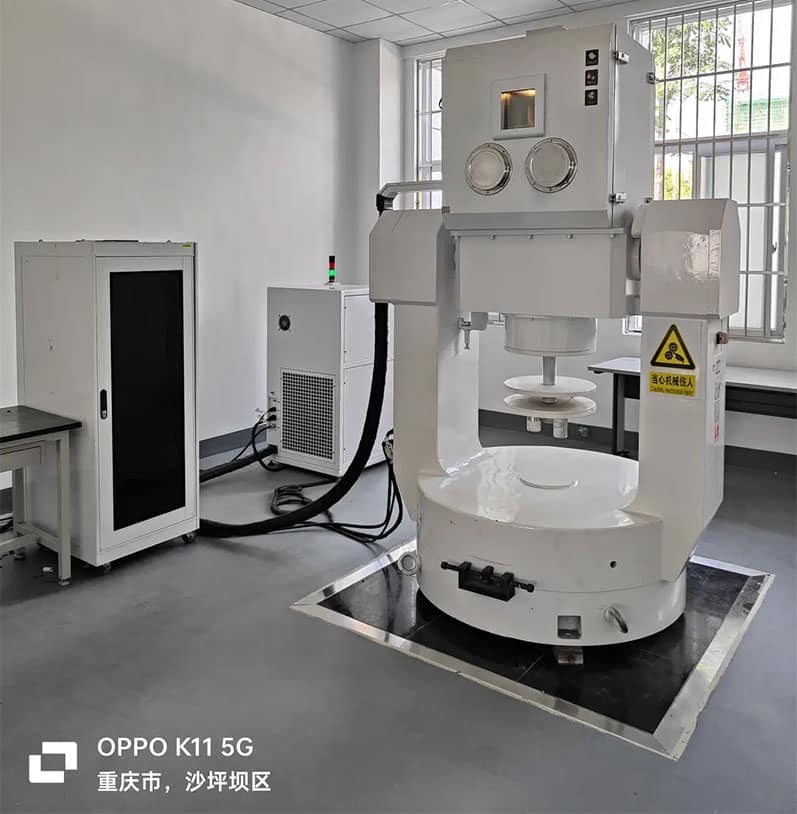
15+ years
125 L turntable chamber
Supplied in 2010 with multiple recorded relocations.
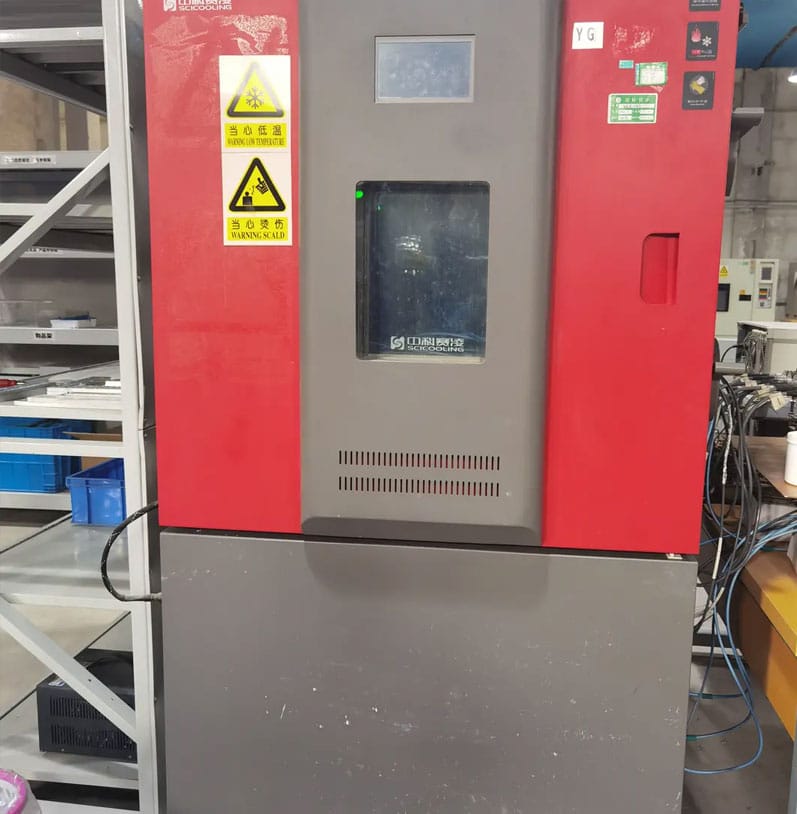
50,000+ h
512 L rapid-change unit
Supplied in 2011; routine-maintenance service history.
Service-age evidence applies to the cited machines and operating histories; it is not a universal lifetime guarantee.
- REMOTE MONITORING · FASTER TECHNICAL RESPONSE
Turn an Alarm into a Structured Diagnosis
Fleet status, alarm context and live curves give the service team a shared evidence trail before deciding whether guided action or an on-site visit is required.
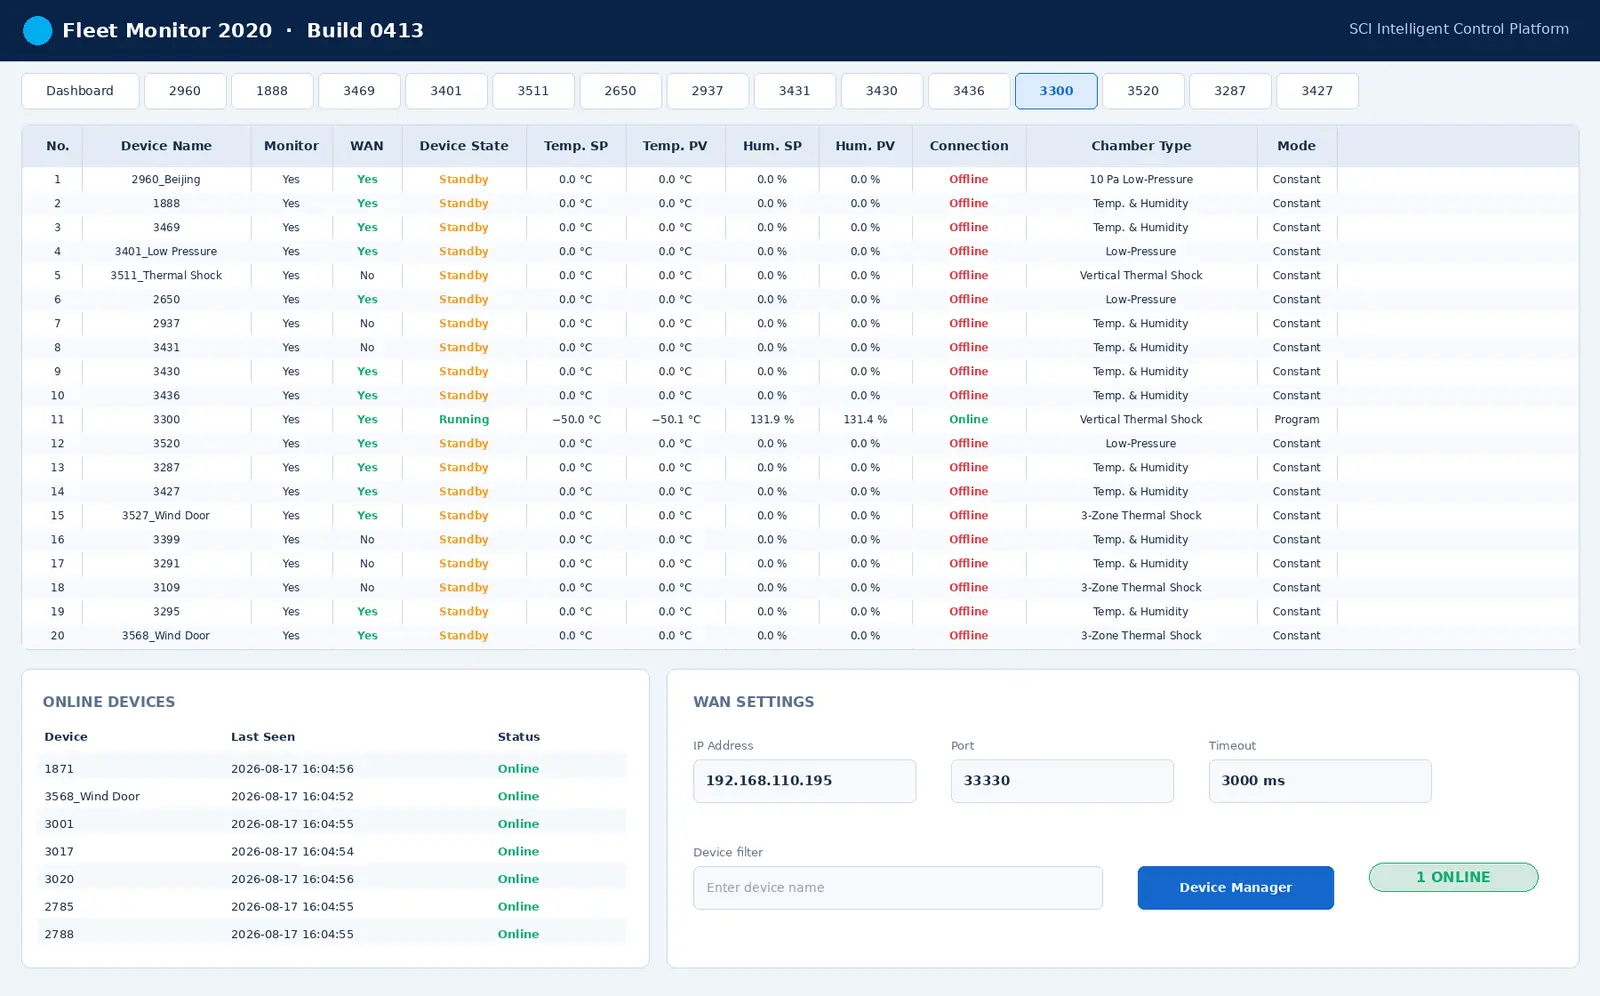
Fleet overview and alarm context
See operating state, current values, program progress and alarm information across connected chambers.
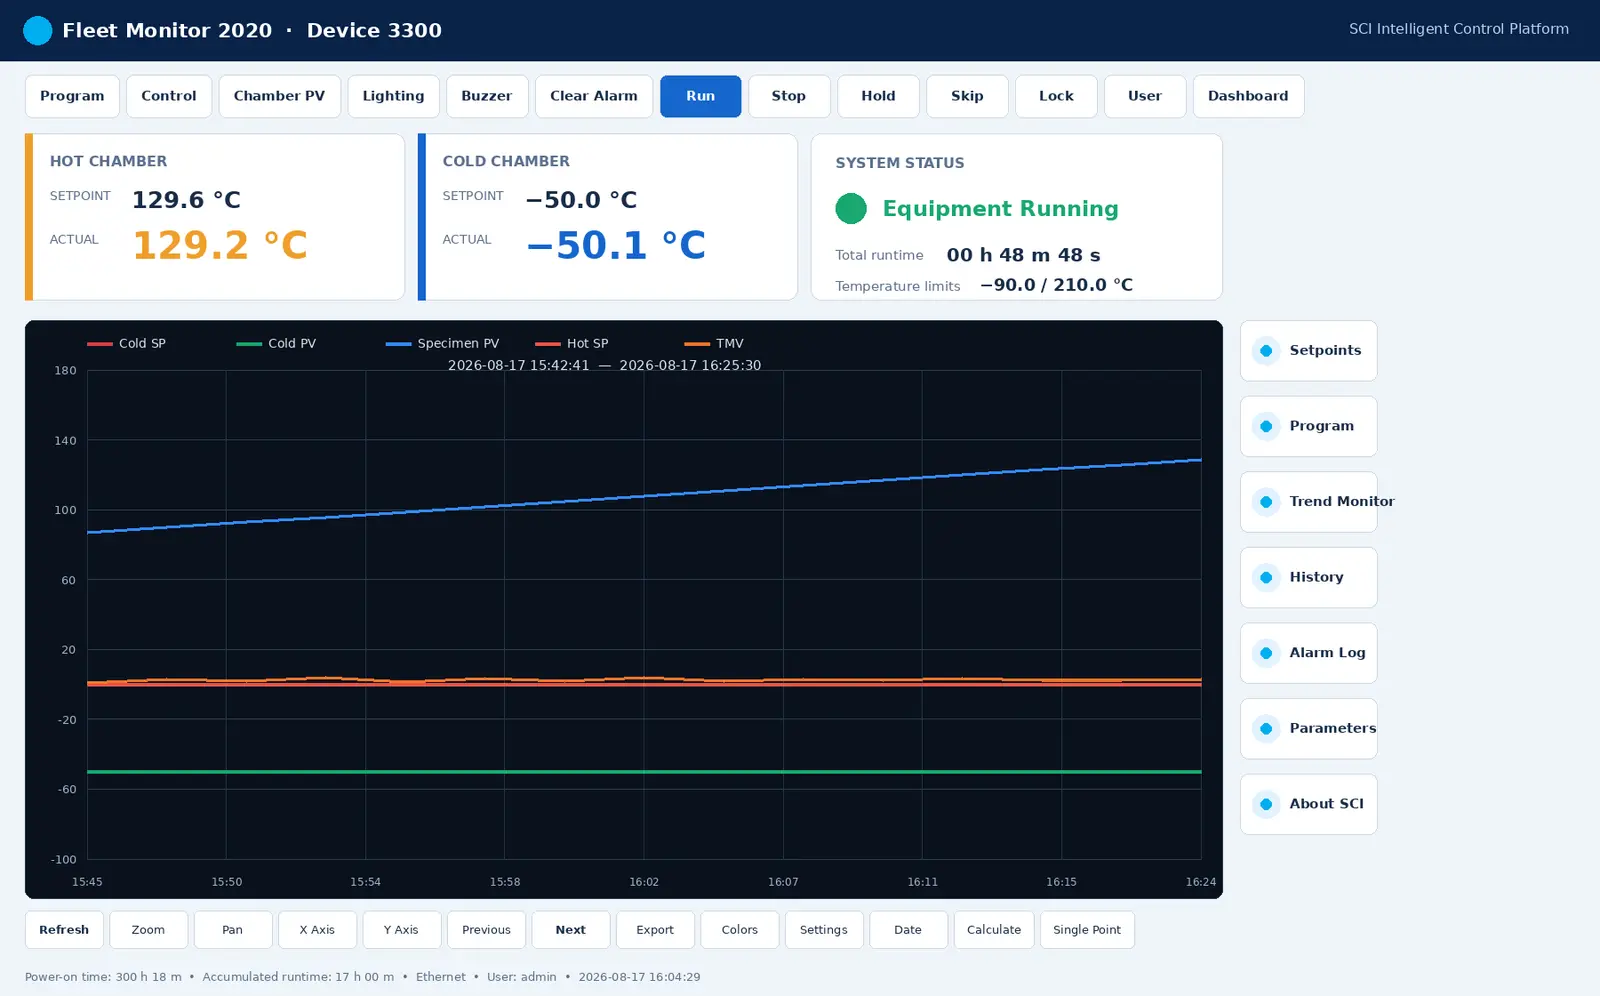
Live SP/PV curves for diagnosis
Share the same trend view with technical support to narrow the likely cause and prepare the next action.
- 01
Detect
Operator sees alarm or abnormal trend.
- 02
Share evidence
Status, curve and alarm data are reviewed.
- 03
Diagnose
Support narrows probable causes and risk.
- 04
Resolve
Guided action or prepared on-site service.
Remote functions depend on the selected controller, network configuration and customer authorization. Hardware faults may still require on-site service.
- CONNECTED BUYER JOURNEY
From Education to Product Proof to Space Planning
Each answer links to the next useful level of detail, so visitors do not reach a dead end.
- 01
408L Golden Product Page
Review an actual model structure: dimensions, configuration, performance evidence, standards and engineering documents.
- 02
Interactive Lab Planner
Enter a lab or factory size, apply installation clearances, then auto-place, drag and rotate equipment.
- 03
FAQ with Deep Links
Answers link directly to footprint drawings, performance curves, standards and the planner—not generic contact pages.
- PROJECT WORKFLOW
A Clear Engineering Path from Requirement to Reliable Use
Documented inspection depth and named long-running machines make the ownership story concrete.
Share the requirement
Standard, specimen, profile and site
Review the application
Feasibility, load, interfaces and safety
Confirm configuration
Model, proposal, drawings and acceptance
Build and verify
Manufacturing, FAT and performance checks
Install and operate
Guidance, training and technical support
- BUYER KNOWLEDGE BASE
From Overall Selection to Product-Specific Questions
Start with the common mistakes that affect every chamber, then filter by climate chamber, rapid temperature change, thermal shock, energy efficiency or remote service.
- ENGINEERING CONSULTATION
Turn Your Test Requirement into a Buildable Chamber Specification
Tell us what you need to test, the environmental profile you must reproduce and the performance your project requires.
- Application and standards review
- Practical chamber configuration
- Initial response within 1 business day
Request an SCI Engineering Review
Share the test profile, specimen, heat load, workspace, utilities and acceptance basis. The official SCI enquiry form below sends your request to the engineering team.