SCI

SCI Verified Performance

SCI PERFORMANCE / 03

The curve
is the proof.

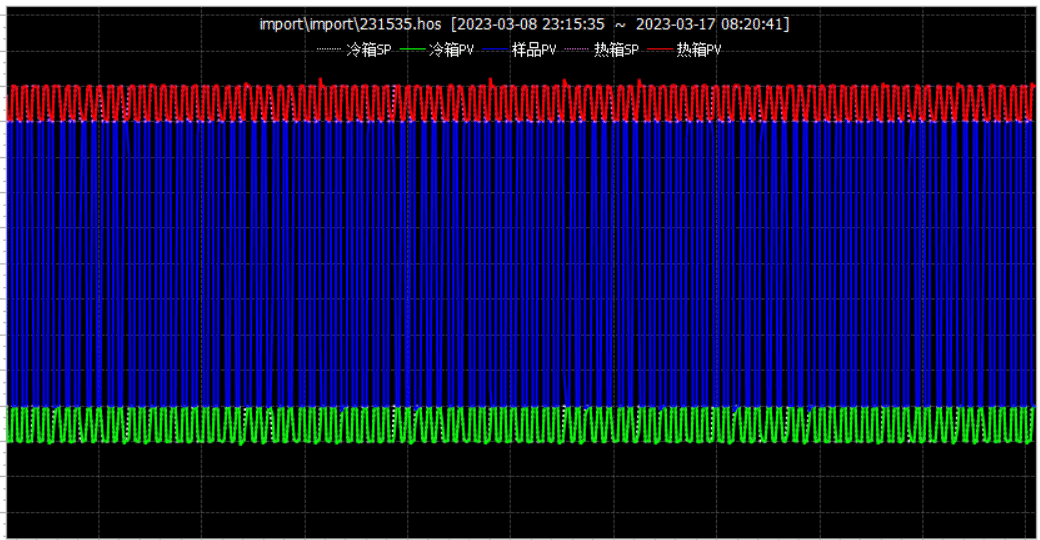
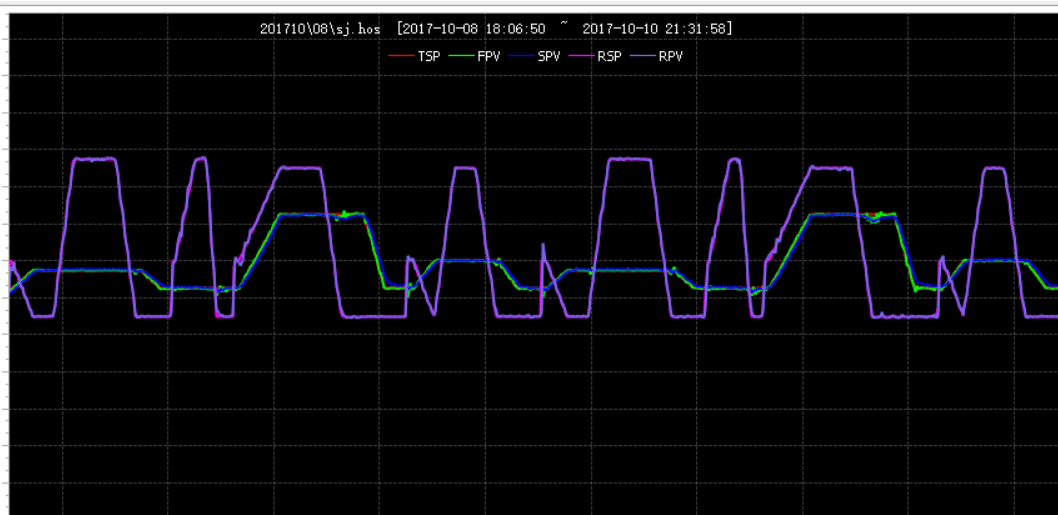
Specifications describe potential. Real profiles show whether a chamber can follow the target, stabilize quickly and repeat the result under the conditions that matter.

Real controller records · Repeated profiles · Load-specific evidence

400 L RAPID-CHANGE PROFILE16-POINT VERIFIED
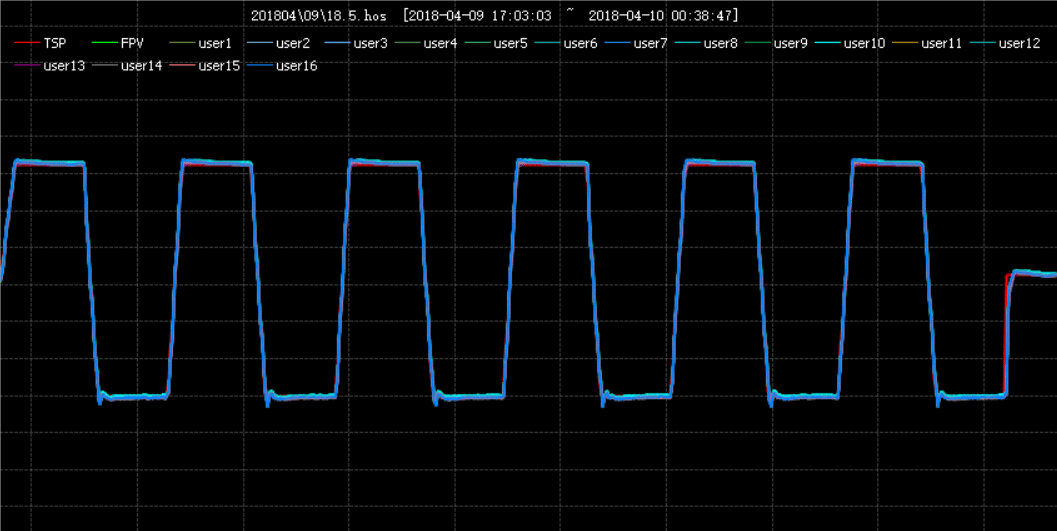
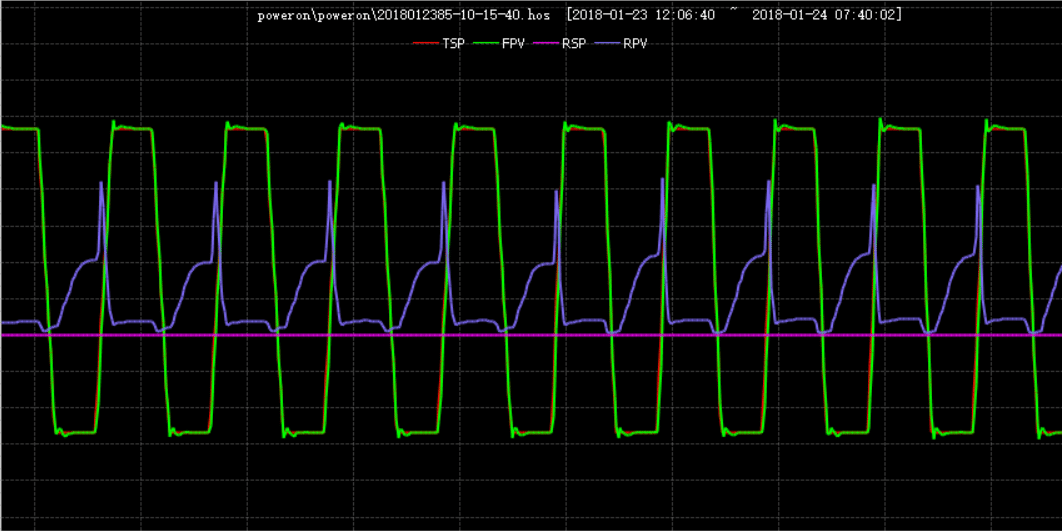
SCI rapid temperature change test curve
20°C/min
linear rate
16measurement
channels
6×repeatable
cycles shown

20°C/min

linear rapid-change record

7°C / 7% RH

low-temperature, low-humidity boundary

2 min 20 s

thermal-shock recovery record

100 m separation

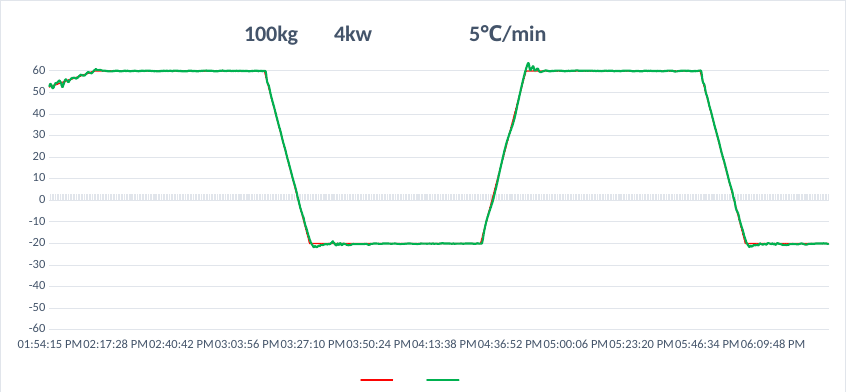
between chamber and remote refrigeration unit · tested with 100 kg + 4 kW load

HOW TO READ A PERFORMANCE CURVE

Look for three things.
Not just a fast line.

A credible curve lets you compare the requested program with the actual chamber response over time. The smaller and more repeatable the gap, the stronger the control result.

01

Track the target

PROGRAM VS ACTUALTIGHT GAP

Compare the programmed setpoint with the measured value. A consistently narrow gap shows that the chamber is executing the requested profile.

02

Watch the recovery

DISTURBANCE RESPONSEFAST SETTLE

After a ramp, transfer or load disturbance, look for the actual value to return quickly and settle inside the permitted band.

03

Check repeatability

CYCLE-TO-CYCLESAME SHAPE

Repeated cycles should preserve the same shape, amplitude and settling behavior. Widening gaps reveal performance loss.

REAL TEST RECORDS

Five demanding profiles.
One way to judge them.

Select a record to see what each curve proves and why it matters to the quality of your test result.

SUPPLIED CONTROLLER RECORD20°C/min linear
400 litre rapid temperature change chamber curve with programmed setpoint and sixteen measurement channels
PROFILE 01

400 L chamber · 16-point temperature verification

400 L workspaceRepeated +85°C / −40°C cycles16 temperature channels
HOW TO READ IT

The red trace is the programmed target. The chamber temperature and all 16 measurement channels rise, settle and fall together through every cycle.

YOUR ADVANTAGE

Fast transitions are useful only when the full workspace moves as one. The tight cluster of measured lines shows repeatable response and rapid field balance.
CONTROL ENVELOPE

Performance beyond
the comfortable middle.

Independent cooling, heating, humidifying and dehumidifying control extends the usable temperature–humidity field—including difficult low-temperature / low-humidity combinations.

0204060801000204060801007°C / 7% RH5°C / 90% RH15°C / 98% RH98°C / 98% RH95°C / 5% RHTEMPERATURE / °CRELATIVE HUMIDITY / % RH
Demonstrated operating boundary points from company-supplied technical records. Final range depends on chamber configuration and load.
5°C90% RH

High humidity at low temperature

15°C98% RH

Near-saturation humidity control

98°C98% RH

High heat with extreme humidity

95°C5% RH

Very dry control at high temperature

1 m³ NO-LOAD BENCHMARK

Wider range.
Faster segment performance.

The supplied comparison keeps chamber volume and no-load conditions aligned. It shows where performance differs across the same temperature segments.

Measured itemSCI chamberImported comparisonDomestic comparison
Temperature range−70 to +150°C−45 to +150°C−40 to +150°C
150 → 100°C2.0°C/min0.4°C/min1.0°C/min
100 → 45°C1.8°C/min0.4°C/min1.0°C/min
45 → 0°C1.5°C/min1.0°C/min1.0°C/min
0 → −40°C1.3°C/min0.9°C/min1.0°C/min
Temperature fluctuation≤ ±0.5°C≤ ±0.5°C≤ ±0.5°C
Temperature uniformity≤ 1.3°C≤ 1.2°C≤ 1.7°C

Read this correctly: rate is shown by temperature segment, because a single headline rate can hide slower parts of the profile. Each segment and control-quality result should be judged separately.

PERFORMANCE UNDER YOUR LOAD

Empty-chamber speed
is not your test speed.

SCI calculates performance around the actual specimen and installation. In this record, “100 m” means the pipe-and-cable separation between the test chamber and its remote refrigeration unit—not the chamber size.

01Target profile

Temperature, humidity, ramps and dwell time

02Specimen load

Material, mass, geometry and live heat output

03Installation

Distance, airflow, utilities and ambient conditions

04Verified result

Capacity, recovery, uniformity and control reserve
Remote cooling test curve under 100 kilogram aluminium and 4 kilowatt heat load
WHAT 100 m MEANSChamber ↔ remote refrigeration unit separationDemonstrated with a 100 kg aluminium load, 4 kW live heat load and 5°C/min linear profile.
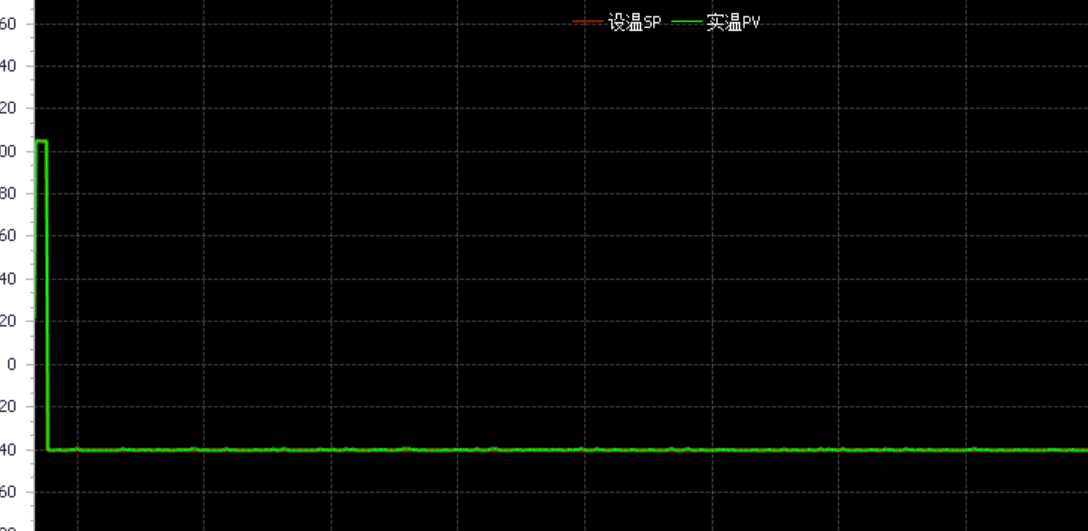
Extended minus 40 degree Celsius temperature hold record
SETPOINT AND ACTUAL VALUE REMAIN ALIGNED NEAR −40°C THROUGH THE EXTENDED RECORD WINDOW

STABILITY IS PERFORMANCE TOO

Fast when changing.
Quiet when holding.

Long dwell tests require a different kind of strength: the ability to stay close to the setpoint without drift, oscillation or unnecessary correction. The supplied record shows the measured temperature locked to the −40°C target across the extended hold.

Stable low-temperature hold Minimal target-to-actual deviation Evidence over time, not one reading

VERIFIED PERFORMANCE / 03

Send us the profile.
We will engineer for the real load.

ENGINEERING CONSULTATION

Turn your requirement into a buildable chamber specification.

Share the essentials. Our application engineers will help define a practical, reliable system.

Application and standards reviewPractical chamber configurationInitial response within 1 business day
SCI INSTRUMENTS CO.LTD
info@scicoolings.com
PROJECT ENQUIRY

Request Engineering Consultation

Tell us the essentials. Our application engineers will help complete the specification.

Quick Chamber Selection
Select your test method, control variables and workspace. SCI will use these inputs to recommend the practical configuration.