
01
Adaptive PID control
Cooling and heating output follow the real test load—without fighting each other at steady state.
SCI ENERGY SAVING
SCI chambers match cooling output to the real test load, helping laboratories reduce operating energy by 30% or more—without compromising temperature control.
Internal comparative tests · Real meter readings · Profile-specific review
typical energy-saving target
coordinated control layers
savings accumulate while running
review against your test profile
WHY IT USES LESS
Conventional hot–cold balance control may keep refrigeration at high output, then add heat to hold the setpoint. SCI changes the cooling source itself—so the chamber receives only the energy it needs.
Excess cooling is cancelled by electric heating just to maintain the target temperature.
Cooling capacity tapers with the real load, with little or no reheating during stable holds.
Cooling and heating output follow the real test load—without fighting each other at steady state.
Compressor speed and output are continuously matched to demand, reducing repeated starts and wasted capacity.
Fast refrigerant regulation keeps control precise across low-temperature and high-load conditions.
REAL CONTROLLER EXPORTS
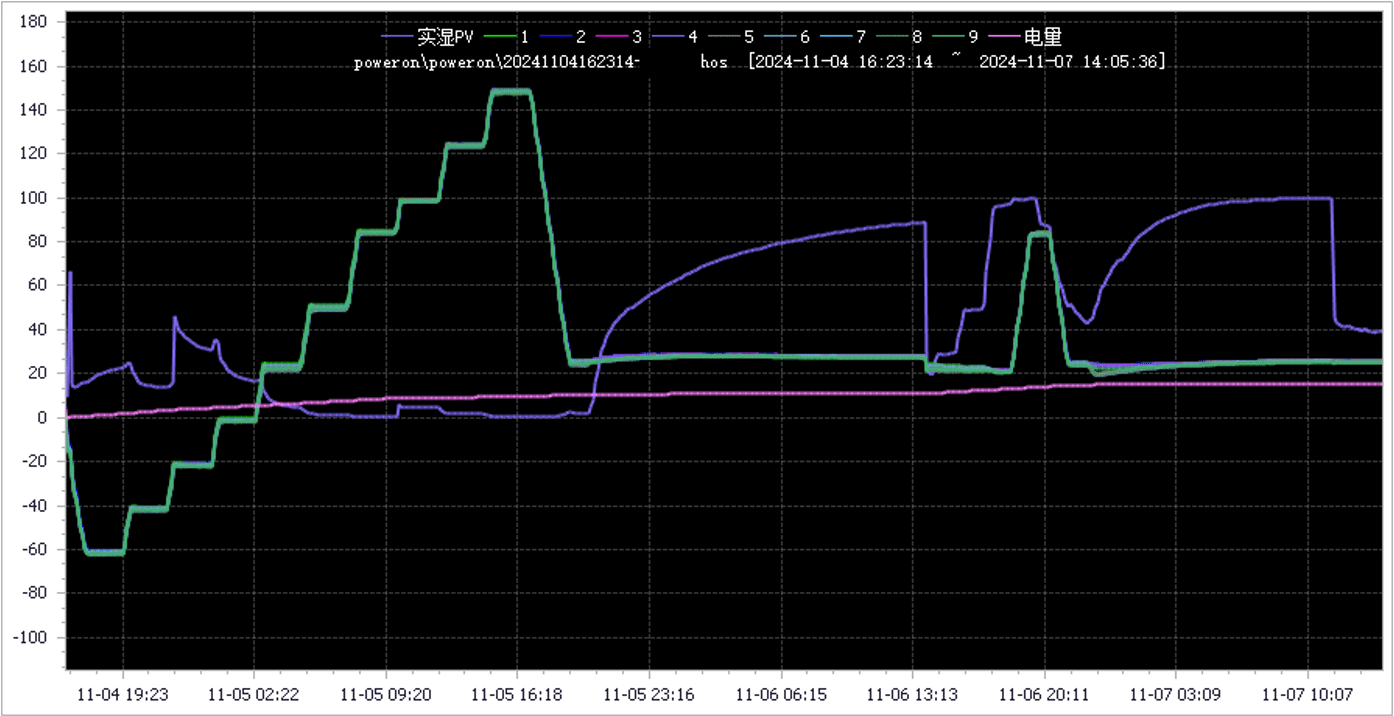
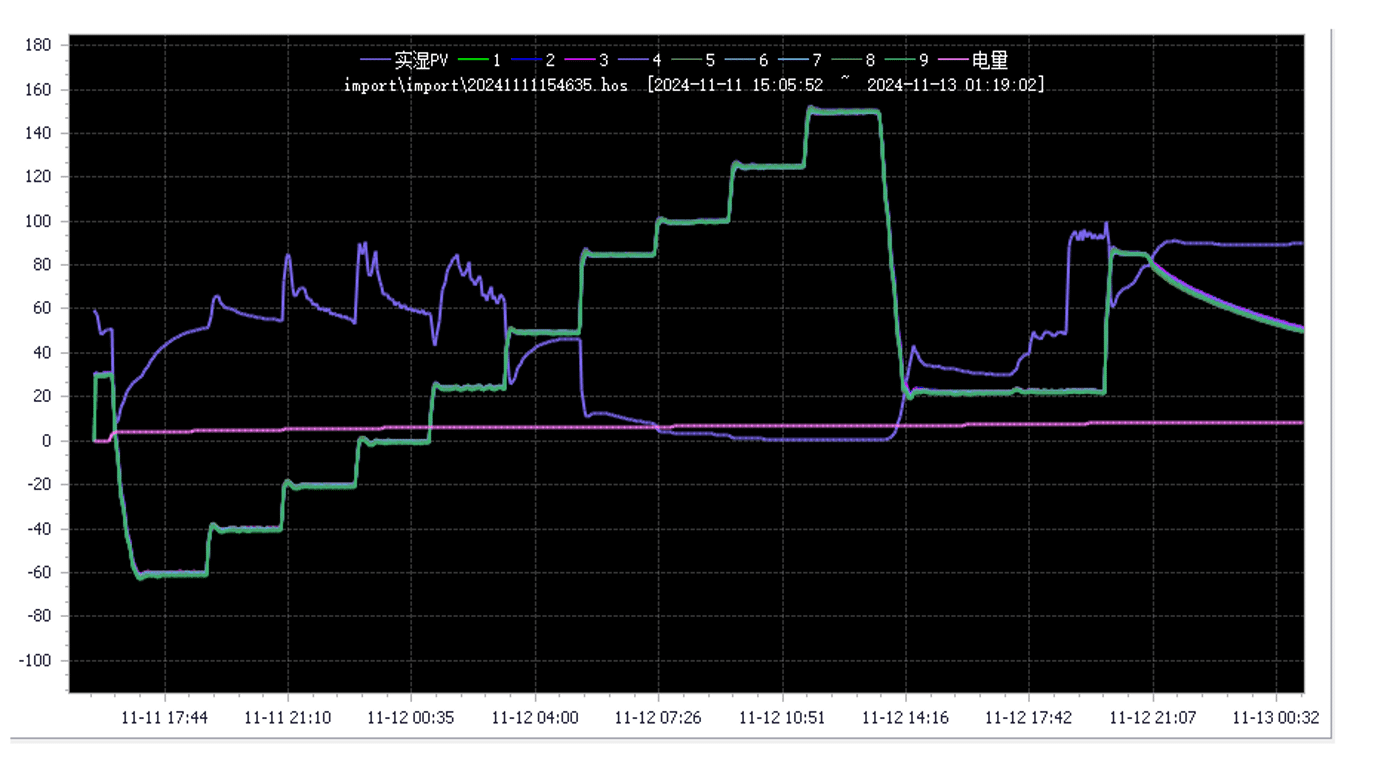
Profile A is the reference competitor chamber. Profile B is the SCI chamber. Both are multi-day controller exports used to compare measured energy consumption at corresponding temperature and humidity hold points.
HOW TO READ THE TEST
Panel A is the competitor reference. Panel B is the SCI chamber. The multiple colored traces inside each panel are controller channels—not separate brands.
Compare corresponding temperature or humidity plateaus. Both chambers must reach and hold the required condition before their consumption is judged.
The electricity channel records real consumption on the same timeline. At the matched hold points, SCI generally uses fewer kWh—showing that cooling output is reduced when full capacity is unnecessary.
WHAT THE DATA SHOWS
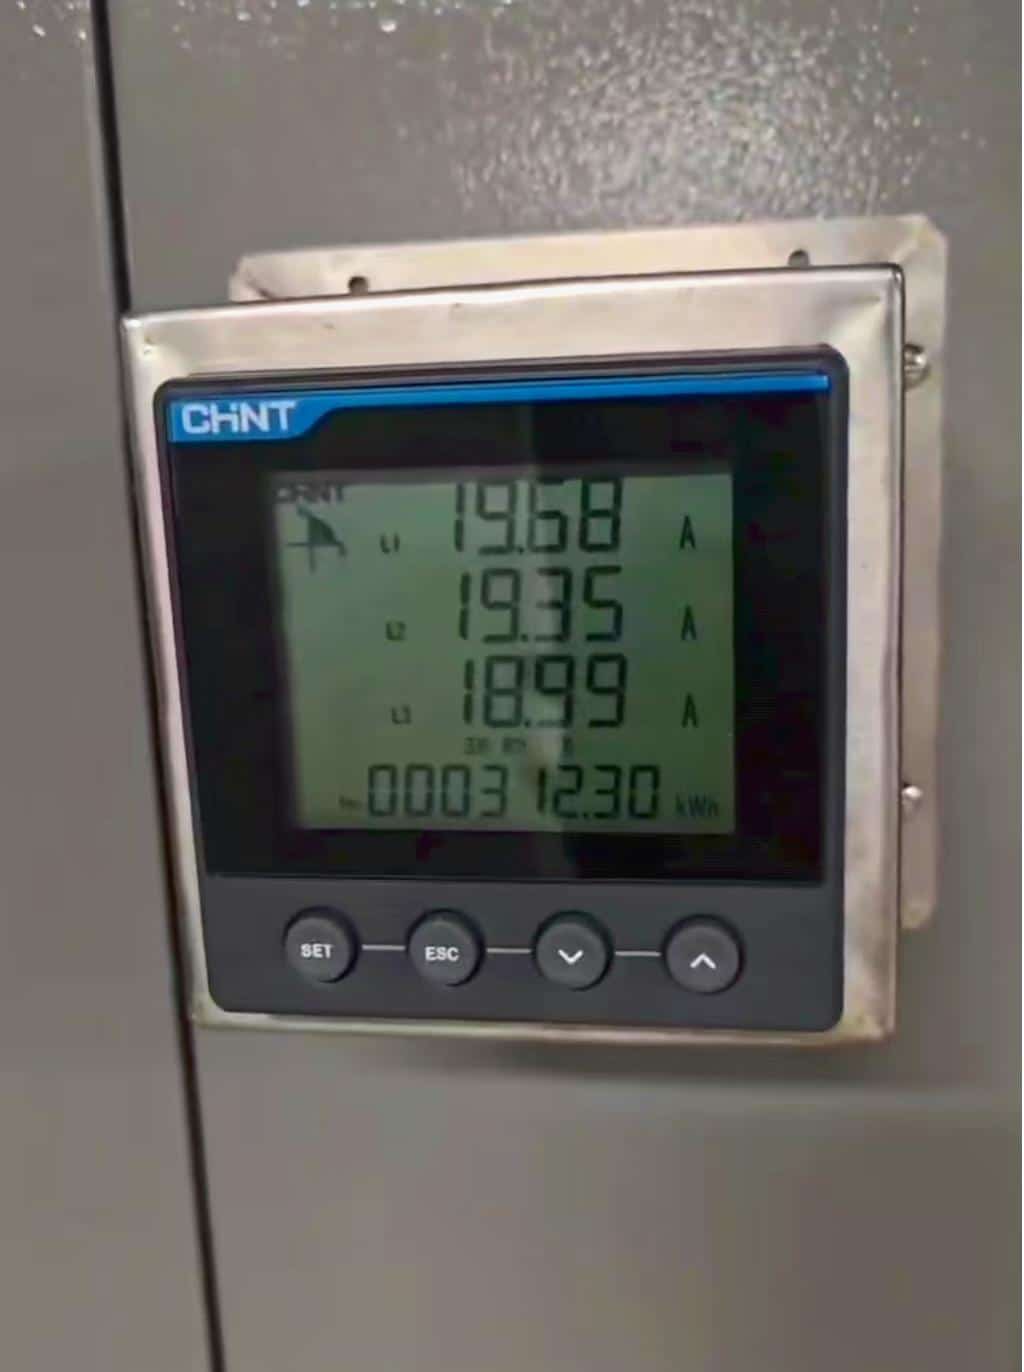
Selected values below come from the supplied 1 m³, −70°C temperature-humidity chamber comparison. Each temperature point was held for two hours; the combined 85°C / 85% RH point was held for one hour.
Every point is shown—including the neutral 23°C / 30% RH result—to avoid cherry-picking.
“The important number is not installed power. It is the energy actually consumed over your real test cycle.”
Source: SCI internal comparative measurement records for a 1 m³, −70°C temperature-humidity chamber. Results are not a guarantee; actual savings vary by model, test profile, ambient conditions and specimen load.
SECOND MEASURED DATASET
A separate 1 m³ rapid temperature-change humidity chamber was measured under low-temperature holds, high temperature, high humidity and a −40°C to 85°C cycle at an average 15°C/min.
average energy saving across the supplied temperature and humidity profiles
SCI’s advantage is not limited to steady-state operation. It remains visible during high-load temperature cycling, where conventional control consumed 60 kWh versus 13 kWh in the supplied test.
SIX TEMPERATURE HOLD POINTS
Each point was tested for five hours. Values show average energy used per hour under the same 1 m³ no-load comparison.
Lowest result at 5 of 6 hold points
Lower than SCI only at −40°C
SCI uses 45% less on average
Transparent comparison: the imported unit is lower at −40°C, while SCI records the lowest consumption at the other five supplied hold points. Actual project results depend on chamber configuration, load and ambient conditions.
INTERACTIVE LIFECYCLE VALUE MODEL
Enter the number of chambers and baseline average energy use per chamber, then set actual operating days and peak / standard / off-peak hours.
Tariff presets are editable planning references—not utility quotations. Replace them with your actual invoice rates for a project estimate.
7.0 baseline kWh/h × 30% × 1 chamber(s) × 16.0 h/day × 300 days = 10,080 kWh avoided / year.
Planning estimate only. Actual savings vary by chamber model, temperature profile, specimen load, ambient conditions and local tariff.
SEND US YOUR TEST PROFILE